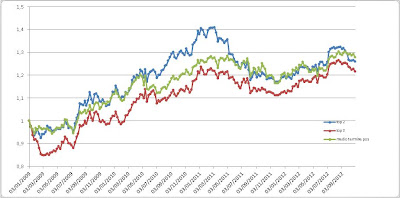
Da qualche settimana potete trovare sulla mia pagina web personale alla Scuola Normale le serie temporali relative a selezioni di portafoglio quantitative costruite in collaborazione con Flavia Poma di Factset
seguendo la metodologia descritta
nell'articolo di Eugene Fama e Kenneth French Common Risk Factors in the Returns on Stocks and Bonds. In estrema sintesi abbiamo costruito dei portafogli selezionando i titoli azionari in base alla capitalizzazione di borsa, al valore di libro e al rendimento negli ultimi 12 mesi. Dalle differenze dei rendimenti di questi portafogli si definiscono tre fattori: SMB (SmallMinusBig), HML (HighMinusLow) e WML (WinnersMinusLosers). Questi fattori rispettivamente misurano l'effetto che la capitalizzazione (piccola o grande), il carattere
value o
growth di un titolo e il momento hanno avuto nell'influenzare i rendimenti storici del mercato.
Ogni mese aggiorniamo i rendimenti dei portafogli e i fattori per quattro mercati
emergenti (Brasile, Cina, India e Corea) e per dodici mercati più maturi (Australia, Canada, Francia, Germania, Giappone, Hong Kong, Italia, Regno Unito, Singapore, Svizzera, Svezia, USA) mettendo a disposizione nuovi files.
Nel grafico qui accanto per esempio potete seguire per esempio l'andamento che i sei portafogli costruiti selezionando titoli sulla base della capitalizzazione e del valore di libro hanno avuto sul mercato Italiano negli ultimi 24 anni. Il sovrarendimento delle azioni
value di piccola capitalizzazione è spettacolare...chi poi fosse riuscito a costruire un portafoglio
long/short vendendo allo scoperto le azioni
growth sarebbe attraversato pressochè indenne persino la crisi degli ultimi cinque anni!
Riporto qui di seguito
una descrizione molto sintetica ma leggermente meno criptica della metodologia che abbiamo seguito
Description of Fama/French Factors
Monthly and Annual Returns
Construction: SMB and HML factors are constructed using the 6
value-weight portfolios formed on size and book-to-market (see the
description of the 6 size/book-to-market portfolios). WML factor is
constructed using the 6 value-weight portfolios formed on size and
momentum (see the description of the 6 size/momentum portfolios).
Rm-Rf, the excess return on the market, is the value-weight
return on all stocks minus the risk free rate.
SMB (Small Minus Big) is the average return on the three
small portfolios minus the average return on the three
big portfolios, SMB = 1/3 (Small Value + Small Neutral
+ Small Growth) - 1/3 (Big Value + Big Neutral + Big
Growth).
HML (High Minus Low) is the average return on the
two value portfolios minus the average return on the
two growth portfolios, HML = 1/2 (Small Value + Big
Value) - 1/2 (Small Growth + Big Growth).
WML (Winners Minus Losers) is the average return on
the two winner portfolios minus the average return on
the two loser portfolios, WML = 1/2 (Small High + Big
High) - 1/2 (Small Low + Big Low).
Stocks: Rm-Rf, SMB and HML for July of year t to June of
t+1 include all stocks for which we have market equity data for the
last fiscal year end before March and June of t, and (positive) book
equity data for the last fiscal year end before March t. The six
portfolios used to construct WML each month include stocks with prior
return data. To be included in a portfolio for month t (formed at the
end of the month t-1), a stock must have a price for the end of
month t-13 and a good return for t-2.
Detail for 6 Portfolios Formed on Size and
Book-to-Market
Monthly and Annual Returns
Construction: The portfolios, which are constructed at the
end of each June, are the intersections of 2 portfolios formed
on size (market equity, ME) and 3 portfolios formed on the
ratio of book equity to market equity (BE/ME). The size
breakpoint for year t is the median market equity for the last
fiscal year end before June of year t. BE/ME for June of year
t is the book equity for the last fiscal year end before March
t-1 divided by ME for March of t-1. The BE/ME breakpoints are
the 30th and 70th percentiles. The independent 2x3 sorts on
size and B/M produce six value-weight portfolios, SG, SN, SV,
BG, BN, and BV, where S and B indicate small or big and G, N,
and V indicate growth (low B/M), neutral, and value (high
B/M).
Stocks: The portfolios for July of year t to June of t+1
include all stocks for which we have market equity data for
the last fiscal year end before March and June of t, and
(positive) book equity data for the last fiscal year end
before March t.
Detail for 6 Portfolios Formed on Size and
Momentum
Monthly and Annual Returns
Construction: The portfolios, which are constructed
monthly, are the intersections of 2 portfolios formed on size
(market equity, ME) and 3 portfolios formed on momentum. The
monthly size breakpoint is the median market equity. For
portfolios formed at the end of month t–1, the lagged
momentum return is a stock's cumulative return for t–12 to
t–2. The monthly momentum breakpoints are the 30th and 70th
percentiles. The independent 2x3 sorts on size and momentum
produce six value-weight portfolios, SL, SN, SW, BL, BN, and
BW, where S and B indicate small or big and L, N, and W
indicate losers (low momentum), neutral, and winners (high
momentum).
Stocks: The six portfolios constructed each month include
stocks with prior return data. To be included in a portfolio
for month t (formed at the end of the month t-1), a stock must
have a price for the end of month t-13 and a good return for
t-2.


