Visualizzazione post con etichetta mercato azionari USA. Mostra tutti i post

lunedì 9 aprile 2012

L'inizio della stagione delle trimestrali

 Domani Alcoa sarà la prima grande società americana ad annunciare i risultati trimestrali. Secondo gli analisti la stagione alle porte sarà la più delicata dell'ultimo paio d'anni, con una crescita attesa degli utili inferiore all'1% (rispetto allo stesso trimestre dello scorso anno), il tasso di crescita più basso dalla fine della crisi finanziaria. Negli ultimi due trimestri i tassi di crescita sono stati dell'8,4% (per il quarto trimestre del 2011) e dell'11% (per il terzo trimestre). Il settore più forte dovrebbe essere proprio quello finanziario, con una crescita degli utili nel 2012 secondo le stime superiore al 13%. Deboli le utilities e le telecomunicazioni, con utili attesi in calo rispettivamente del 5,7% e dello 0,6%. 

venerdì 21 ottobre 2011

Caro o a buon mercato? La valutazione dei mercati americani ed europei

Nel video qui sotto John Bogle, il fondatore di Vanguard e uno dei fondatori della moderna industria finanziaria, discute la valutazione attuale dei mercati azionari (un tema da lui affrontato anche in questo articolo sul Wall Street Journal di un mesetto fa). Ecco quanto prevede per i prossimi dieci anni a partire dalle valutazioni attuali:


The dividend yield you know; today’s dividend yield is a known fact. Earnings growth tends to be very similar to the rate of GDP growth at around 5%, 6%, and that's nominal. So we've got to be careful about that. And P/Es if they are over 20, the odds are great that they will be lower at the end of the decade, and if they are under 10 or 12, the odds are they will be much higher at the end of the decade.
So we know much more than we think we know. And using that analysis, I'd say the 2%-plus dividend yield, let’s say a 5% or 6% earnings growth, let’s call it a 7% return, and maybe a loss of a point in a lower P/E, or maybe not. So putting it all together, you get around a 7% forecast outlook for stocks, which is not bad, because you are going to double your money, in nominal terms again, double your money over a decade if we are fortunate to get that 7% return. That's well below the historical norm, however, of 9%. And I think that's reasonable, if only because the dividend yield, a crucial part of this, is, over the long term, 5%, over 100 years, and now it's 2.25%. So that suggests lower returns in the future.


Il punto critico dell'analisi qui sopra è l'idea che l'economia cresca al ritmo del 5-6% nominale nei prossimi 10 anni: Con l'inflazione USA intorno al 3% significa una crescita reale del 2-3%. Possibile ma non scontato, vista la situazione attuale e le magre prospettive dell'età del deleveraging che dovremo affrontare nei prossimi anni.

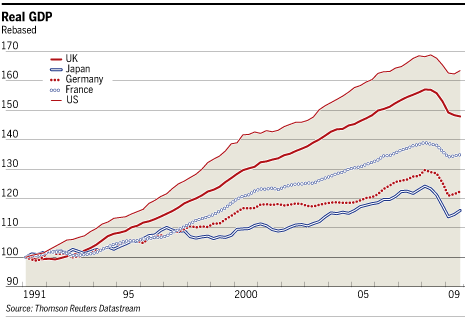
L'Europa, se riuscisse a superare i suoi problemi almeno in parte, potrebbe essere in una situazione molto migliore: il dividend yield è considerevolmente più alto, circa il 4%. Purtroppo il tasso di crescita reale del GDP è stato storicamente decisamente inferiore: nei 20 anni che separano il 1990 dal 2010 gli USA sono cresciuti a un tasso reale pari al 2,4% annuo mentre il Regno Unito ha avuto una crescita reale del 2%, la Germania dell'1% e la Francia appena dello 0,8%. Abbastanza per quasi cancellare l'extra-rendimento che viene dal dividend yield. D'altra parte i mercati europei vedono in questo momento dei multipli prezzo/utili decisamente bassi (tra 8 e 10) e un'espansione del multiplo del 50% su 10 anni (assestandosi così tra 12 e 15) aggiungerebbe un 2% annuo al rendimento atteso. In conclusione: con un po' di fortuna, se la crescita reale dell'economia sarà almeno pari all'1%, nel prossimo decennio l'Europa potrebbe mettere a segno un rendimento reale del 7% !!
Un po' di ottimismo viene anche dalla stima dei rendimenti attesi dei mercati degli analisti di GMO 
che per i prossimi sette anni prevedono un rendimento reale delle large cap americane intorno al 3%, poco inferiore al 7% nominale previsto da Bogle, ma si aspettano un rendimento reale annuo superiore al 7% dalle azioni a grande capitalizzazione dei mercati sviluppati e dei mercati emergenti.

venerdì 8 luglio 2011

Le stime sugli utili 2010 e il difficile mestiere dell'analista

Secondo le sitme degli analisti finanziari  i profitti delle compagnie che compongono l'indice S&P 500 dovrebbero avere una crescita superiore al 13% confrontando le stime bottom-up per l'anno 2012 con quelle per l'anno 2011. Nel 2009 gli utili per azione complessivi dell'indice S&P 500  sono stati di $57.12 con una crescita spettacolare a $83.32 nel 2010, corrispondenti alla ripresa dopo la recessione. Gli utili attesi per il 2011 son pari a $97.46 e le stime per il 2012 alla data del 30 giugno scorso si attestano a $110.70 (secondo Standard and Poors, alla data del 6 luglio, sfiorano i $113).
Il rapporto price/earnings  dell'indice per il 2010 era circa pari a 15.9x  ma è atteso in calo a 13.6x per il  2011 e in ulteriore discesa per il 2012 (con il prezzo calcolato al valore di chiusura di ieri dell'indice, cioè 1353) attestandosi a circa 12x for 2012. Se confrontato con i rendimenti delle obbligazioni del Tesoro U.S.A. decennali, intorno al 3.15%, questi multipli sono molto attraenti, con un earnings yield che cresce dal 7.3% del 2011 all'8.3% atteso per il 2012.

Ma la realtà potrebbe essere ancora migliore: gli analisti sistematicamente a sottostimare gli utili e le sorprese positive (annunci trimestrali degli utili migliori delle stime degli analisti) sono state più numerose delle sorprese negative (annunci trimestrali degli utili peggiori delle stime degli analisti) in un rapporto di circa 3:1.

Questo dato incoraggiante deve essere però confrontato con un dato meno entusiasmante: secondo Thomson Reuters il rapporto tra le comunicazioni (da parte delle società stesse) di profitti attesi in ribasso e quelle di profitti attesi in rialzo è aumentato a circa  2.6 da un valore di 1.8 per il primo trimestre del 2011 e di circa 1.2 per il secondo trimestre del  2010: una proporzione crescente di società ha dunque preannunciato che i profitti non saranno all'altezza delle attese.


Una seconda ragione per essere prudenti viene dalle considerazioni che Jason Zweig ha fatto qualche giorno fa sul Wall Street Journal: anticipando l'incipiente earnings season con il tradizionale bombardamento mediatico Zweig osserva come  a dispetto del fatto che la percentuale di società che hanno superato le attese venga utilizzata come un barometro della condizione generale dell'economia e delle tendenze future degli indici azionari these positive surprises are becoming so common they are nearly universal. They are predetermined in a cynical tango-clinch between companies and the analysts who cover them. And there is no reliable evidence that the stock market as a whole will earn higher returns after periods with more positive surprises.
In the first quarter of 2011, according to Bianco Research, 68% of the companies in the S&P 500 earned more than the consensus, or median, forecast by analysts.
What's more, that quarter was the ninth in a row when at least two-thirds of the companies in the S&P generated positive surprises—and the 50th consecutive quarter in which at least half of the companies surpassed the consensus forecast of their earnings.
Even in the depths of the financial crisis, from the third quarter of 2008 through the first quarter of 2009, between 59% and 66% of companies beat expectations, according to Wharton Research Data Services, or WRDS.
In short, there isn't anything surprising about earnings surprises. They aren't the exception; they are the rule. "All the numbers are gamed at this point," says James A. Bianco, president of Bianco Research.
With trading volumes down on Wall Street and commission rates near record-low levels, brokerage firms are starved for the revenue that stock trading used to provide. Since changes in earnings forecasts encourage many investors to buy or sell, analysts have an incentive to revise their predictions more often. But that hasn't made the forecasts more accurate. On average, according to Denys Glushkov, research director at WRDS, stock analysts are revising their earnings forecasts nearly twice as frequently as they did a decade ago. And while the typical forecast missed the mark by 1% in the 1990s, that margin of error has lately been running at triple that rate.
What's going on here? In what used to be called "lowballing" but now goes by the euphemism of "guidance," an analyst will guesstimate what a company will earn over the next year or calendar quarter. Then the company "walks down" the analyst's forecast by providing a series of progressively lower targets until the analyst's prediction falls slightly below where the actual number is likely to come out.
Voila: The company gets to announce earnings that are better than expected, while the analyst gets to tell his investing clients that his estimate was pretty accurate and conservative to boot. (...)

With analysts playing the guidance game more than ever, their forecasts tell us less than ever about where the stock market is going. So over the next few weeks, don't be fooled into thinking that there is anything surprising about the flood of positive earnings surprises. And don't believe anyone who tries to tell you that these fake surprises mean nothing but good times are ahead for the economy and the stock market.

mercoledì 6 luglio 2011

Luglio: un buon mese per investire nei mercati ma non per farsi operare?


Gli appassionati della ricerca di effetti stagionali nei mercati azionari considerano i mesi estivi mesi nei quali è bene fare altro: il vecchio adagio è "sell in May and go away" e la maggior parte dei crash famosi sono concentrati in settembre-ottobre considerati da sempre mesi molto rischiosi. Il track-record dell'estate è più controverso: a volte si sente parlare di rally estivo, soprattutto in agosto quando i volumi sono ridotti ai minimi (specialmente in Italia...). L'analisi della performance media dell'indice Dow Jones dal 1950 ad oggi (colonne blu) e dal 1980 ad oggi (colonne grigie) prodotta da chartoftheday.com suggerisce come luglio sia un mese ragionevolmente buono, al contrario di agosto (piatto) e settembre (il peggior mese dell'anno). Questo tipo di statistiche fatte su campioni esigui e dati ad alta varianza dev'essere davvero presa con le molle. Per di più l'analisi di cxoadvisory dal 1990 ad oggi indica come luglio sia diventato progressivamente più debole come mostra il grafico qui accanto che riporta il profilo giornaliero del mese calcolato sull'indice S&P500: The following chart shows the average month-to-date percentage change in the S&P 500 index by trading day during July from 1990 through 2010. Day 0 represents the June close. It shows that the index during July tends to be about flat, with the first half of the month stronger than the second half (...) For 1990-2010, 12 Julys have been losers and nine winners.
Un'altra ricerca di Cxoadvisory sul turn-of-the-quarter effect sembra poi suggerire come il rimbalzo delle ultime 3-4 sedute possa essere dovuto a questo fenomeno per il quale c'è una debole evidenza statistica: al termine di ogni trimestre i fondi di investimento cercano di rendere un po' più attraenti i rendimenti che verranno riportati nei prospetti informativi e così facendo muovono i mercati al rialzo.
 
Gli analisti di morningstar vengono in soccorso dei tori che si ostinano a fare trading sotto l'ombrellone sostenendo che i mercati sono ancora governati dall'avversione al rischio e osservando come nel bimestre maggio-giugno si sia assistito a una robusta fuga dagli investimenti in azioni, un segnale tradizionalmente contrarian

Convinced that we were still in a "risk-aversion" cycle at the beginning of the year--with investors likely to gradually increase their risk appetite during stable and expanding markets, only to pull back dramatically during market declines--I was surprised to see so much capital go into equities during the first few months of 2011, especially given all of the unrest in the Middle East and the slough of natural (and not so natural) disasters that impacted several major economies in the Asia-Pacific region. But during the last couple of months, things seem to have trended back toward the "risk-aversion" theme that we've observed since the market bottomed in March 2009, as concerns over the ongoing debt crisis in Europe, the struggling U.S. housing and employment markets, rising oil and gas prices, and the impending end of the Fed's second round of quantitative easing (dubbed QE2) all have weighed on the willingness to invest in equities. While the S&P 500 Index is still up marginally year to date, the benchmark index has lost more than 5% of its value since the start of May, with investors signaling their displeasure by pulling back more dramatically on their commitment to both U.S. and international stock funds.

According to data provided by Morningstar Direct, investors pulled more than $4 billion out of U.S. stock funds during the month of May; based on our own estimates, investors are on pace to pull another $6 billion out this month. This compares rather unfavorably with the more than $26 billion that was diverted into these same funds during January and February of 2011. Inflows into international stock funds are also well off the pace set during the first quarter, with less than $2 billion flowing into these funds in May and what we estimate to be a return to net outflows this month. In the meantime, inflows into taxable bond funds have picked up some steam, looking to close out the first half of 2011 at more than $100 billion. Should this trend persist through the second half, we could see a third-straight year with investor inflows into taxable bond funds in excess of $200 billion. Also of note is the fact that the mass exodus from municipal bond funds that started in November seems to be winding down, with net flows being flat in May and likely to return to positive territory in June.


Se l'effetto di luglio sui mercati mobiliari è controverso (ammesso che questo tipo di ricerche abbia un senso...) pare invece che sia accertato che in luglio negli Stati Uniti è meglio evitare di finire sotto i ferri dei chirurghi: come spiega Wikipedia il July effect
è il rischio aumentato di complicazioni post-operatorie che si verifica in questo periodo dell'anno, secondo alcuni a causa dell'immissione nelle corsie dei nuovi specializzandi ancora freschi di teoria ma digiuni di pratica....:
A Journal of General Internal Medicine study, published in 2010, investigated medical errors from 1979 to 2006 and found that medication errors increased 10% during the month of July at teaching hospitals, but not in neighboring hospitals.[1][2]

La strategia market neutral del mese? Lunghi l'indice azionario e corti le assicurazioni sanitarie....