Visualizzazione post con etichetta flash crash. Mostra tutti i post

venerdì 24 maggio 2013

Il flash crash delle utilities di ieri: Chi avuto ha avuto, chi ha dato ha dato, scurdammoce u‘passato...

Leggo oggi sull'Investors Business Daily che il mercato USA ieri

... fared much better, but not without a dash of flash-crash hysteria. Two utilities, American Electric Power (AEP) and NextEra Energy (NEE), plunged 54% and 62% in the first minute of trade.

Both stocks recovered quickly from the flash crash, but the NYSE said the trades will stand. The exchange decided to exclude the trades, though, from its low and high prices in its data feeds.

Ma stiamo scherzando? Cosa vuol dire che le transazioni eseguite sono valide ma non sono incluse nella serie storica dei prezzi degli eseguiti? Si vergognano??  Ma siamo a New York o a Napoli? Ricordate la canzone?

Chi ha avuto, ha avuto, ha avuto... chi ha dato, ha dato, ha dato... scurdámmoce 'o ppassato, simmo 'e Napule paisá!...

sabato 6 ottobre 2012

I mercati instabili: un flash crash a Mumbai e un convegno a Pisa

Dal Financial Times di ieri: un flash crash indiano!

October 5, 2012 10:45 am

Indian shares suffer $60bn ‘flash crash’


Almost $60bn was wiped from the stock market value of India’s biggest companies on Friday when a “flash crash” on the country’s stock exchange triggered a near 16 per cent slide in the main index.
India’s National Stock Exchange, Asia’s fourth largest bourse based in Mumbai, was forced to halt trading briefly after 59 erroneous orders from a basket of trades caused the so-called “Nifty Fifty” index to drop as much as 15.6 per cent within minutes.
The index recovered after mistaken orders were cancelled but the huge swing is the latest in a string of such moves on global exchanges and comes as regulators are stepping up their scrutiny of new trading technology and its impact on market stability. It follows a glitch this week on New York’s Nasdaq when shares in Kraft Foods soared as much as 28.9 per cent in the first minute of trading...


Il crash di Mumbai, così come il lunedì nero del 1987, e il flash crash del 6 maggio 2010, sono solo alcuni esempi tra i tanti di eventi nei quali i mercati si muovono di oltre 20-25 deviazioni standard!

Ne parleremo il 18 e il 19 ottobre prossimi in un simposio alla Scuola Normale Superiore, nel 202esimo anniversario della sua fondazione...e anche in occasione del 25esimo anniversario del lunedì nero.

mercoledì 4 aprile 2012

Quante farfalle nei giardini dell'HFT! La S.E.C. apre un'inchiesta sul trading ad alta frequenza

Il dibattito sulle tecniche utilizzate nel trading algoritmico ad alta frequenza (HFT) e sulla loro legittimità diventa sempre più acceso: il WSJ oggi dà la notizia di una investigazione della S.E.C. ad ampio raggio. Secondo il quotidiano


[SECPROBE]
One such area under SEC scrutiny is the use of routing and trading instructions, known as order types. Many investors use relatively simple order types, such as limit orders, which specify a price at which an investor is willing to buy or sell a stock.
But exchanges also offer more sophisticated order types commonly used by rapid-fire traders that could potentially give them an edge over other investors, according to industry experts. Some allow computer-driven traders to hide orders and prevent them from routing to other exchanges, where the traders may have less control over the order execution.
One order type, called "Hide Not Slide" and offered by the exchange operator Direct Edge Holdings LLC, is among those being scrutinized by the SEC, according to people familiar with the matter. The agency is also looking at a similar order type offered by computerized stock exchange BATS Global Markets Inc., the people said.
Other exchanges also offer order types that share similar characteristics. Representatives of Direct Edge and BATS declined to comment.
The SEC is examining whether such order types unfairly allow high-speed traders to jump ahead of other investors in an exchange's "order book," or the queue of buy and sell orders that are typically ranked by price and when they were received, according to people familiar with the matter.
Another area of focus for the SEC are the rebates some traders earn from exchanges even as other investors pay fees to complete trades, say people familiar with exchange operations and the SEC probes.
The SEC stepped up its scrutiny of these high-speed trading firms and exchanges after the May 6, 2010 "flash crash," when computerized trading triggered a 9% selloff within minutes.
Some aspects of the SEC's inquiry are tied to at least one whistleblower, according to people familiar with the matter.
One of the most prominent lines of inquiry involves BATS, which last month pulled its initial public offering after halting trading due to what it described as a software glitch. On the morning BATS shares began trading, The Wall Street Journal disclosed details of the SEC's investigation into whether superfast-trading firms have exploited their links to BATS and other exchanges to gain an unfair advantage over other investors.
Il livello dello scontro è tale che il WSJ pubblica simultaneamente alle notizie (dovute) riportate nell'articolo precedente una difesa a spada tratta dell'HFT  dal titolo eloquente:

Can We Live With High-Speed Trading? The alternative is to place politics above innovation.


Dopo una difesa di BATS l'autore entra nel merito di alcune delle accuse specificatamente mosse all'HFT.  

High-speed trading exacerbates volatility. But lately volatility appears to have subsided and the high-speed traders are still around, which suggests the vast uncertainties associated with the mortgage meltdown and global debt crisis are a better explanation of yo-yoing markets in the last few years.

The latest accusation is that electronic trading corrupts the major indexes. Because so much trading takes place in off-exchange "dark pools" and matching engines, one estimate holds that only 30% of trades end up reflected in the Dow Jones industrial Average and the S&P 500 index.

But the question has to be, So what? Wasn't the gripe that high-speed trading is noise trading, conveying no real information to prices? And the very arbitrage that high-speed traders engage in keeps prices in lockstep between the visible and invisible trading venues.

In all that humans do, errors and snafus are endemic. Most innovations are of little real value in the long run, and shaving thousandths of a penny off transaction costs certainly isn't curing cancer. Against these modest expectations, electronic trading at least has disproved the idea that trading in a given stock is a natural monopoly because of the benefits of concentrating liquidity. Cheap, fast electronic trading, by arbitraging away price differences, allows us to benefit from competition among exchanges while still getting good price discovery.

Nostalgists and reactionaries, even when they have a case, need to keep in mind the cost when politicians and regulators are licensed to decide which innovations will be permitted. Powerful institutions like the New York Stock Exchange and Nasdaq have been forced to adapt. Perhaps the real miracle is that the American political system still allows a new fat cat to come along and knock down an old fat cat.

The 1987 crash was also blamed on computerized trading strategies. For the retail investor, the thing to keep in mind is that you don't have to buy or sell until you see a price you like. Market volatility, especially volatility caused by passing computer glitches, meanwhile is just spectacle. 

Alcune osservazioni sono comprensibili e forse condivisibili ma la conclusione è francamente ridicola e ignora decenni di ricerche di finanza ed economia comportamentali. Dire che il piccolo investitore può felicemente ignorare la volatilità dei mercati è una chiara ammissione di non aver fatto nemmeno uno sforzo per capire la frustrazione di quanti il 6 maggio 2010 si sono visti chiudere posizioni perchè stop orders venivano eseguiti in un momento di "yo-yoing" (costoso questo yo-yo...). 

Rispondere So what? a chi si preoccupa della mancanza di trasparenza della struttura che i mercati mobiliari 
hanno assunto sarebbe forse ammissibile (anche se personalmente non sono d'accordo) se non si continuasse nello stesso articolo a insistere sul contributo che l'HFT darebbe all'efficienza dei mercati. Efficienza questa che richiede trasparenza dei prezzi e rendicontabilità delle transazioni. Infine il punto più importante è sistematicamente eluso: è davvero desiderabile un mercato nel quale le asimmetrie tecnologico-informative siano esacerbate? Ribadisco qui le conclusioni dell'articolo che abbiamo scritto (Fabrizio Lillo ed io) sul Sole 24 Ore circa un anno fa


Benchè l'HFT non abbia direttamente causato il flash crash, è stato senz'altro complice del contagio e ha contribuito a generale lo stato di instabilità del mercato. Ricerche empiriche mostrano che grandi fluttuazioni di prezzo sono ben più frequenti in anni recenti. In questa situazione una perturbazione relativamente modesta può essere amplificata da feedback positivi e avere un effetto devastante su un sistema di mercati altamente interconnessi, richiamando alla memoria la metafora dell'effetto farfalla popolarizzata dalla teoria del caos deterministico. Il ruolo dell'HFT nella stabilità dei mercati non è completamente chiarito. L'industria, la comunità accademica e i regolatori dovrebbero rivolgere i loro sforzi verso la comprensione e la regolamentazione di questa importante componente dei mercati finanziari. 

sabato 31 marzo 2012

I mercati intermittenti....

Dal New York Times:

Stock Market Flaws Not So Rare, Data Shows

Stock market disruptions like the ones last week that temporarily shut down part of the nation’s third-largest exchange and briefly halted the trading of Apple shares are more common than investors may think.

Although traders and the public were stunned by the problems on the BATS Global Markets stock exchange on Friday, a review of industry data shows that market disruptions large and small are a daily occurrence. The frequency of the problems has rattled the confidence of some investors and companies raising money through supercharged electronic markets.

The communication breakdown that blocked trading on parts of the BATS exchange for more than an hour has been seen in at least 110 instances across the nation’s 13 stock exchanges over the last year, a review of data from Nasdaq shows. That number has gone up every year since 2007.

In one instance in January, BATS said it was unable to trade with the New York Stock Exchange for nearly 30 minutes.

Meanwhile, exchanges have halted trading in company shares after sudden spikes or falls, as happened Friday with Apple, at least 265 times over the last year — more than one for every day of trading, according to data analyzed by the Tabb Group, a market research firm. These circuit breakers kick in after stocks experience 10 percent swings in a short period of time and can be caused by a technical error or waves of electronic trading on news developments. (...)

In addition, minor events at one exchange risk spiraling out through other exchanges and setting off a severe flash crash, like the one seen in May 6, 2010, when major markets fell more than 8 percent in a matter of minutes.

Blame for the market disturbances has fallen on the growing complexity and speed of the nation’s 13 official stock exchanges — three of which are owned by the New York Stock Exchange — and dozens of less official platforms for trading. A decade ago there were only two major trading platforms, and transaction times were measured in seconds.

A regulatory change in 2007 threw open the floodgates of competition by forcing stock trades to be routed to the exchange with the best price, as long as the exchange could act immediately. The proliferation of exchanges since then has lowered the price of trading for investors, and trade times are now measured in milliseconds. In the race for speed, however, some industry experts say reliability has been sacrificed. (...)

The S.E.C. and other regulators have been examining the vulnerabilities of the market, and the impact of high-speed trading, since the flash crash in May 2010. A new committee for the Commodity Futures Trading Commission examining the issue was set to meet for the first time on Thursday.

The S.E.C. has already taken several steps to head off moments of market chaos, including the circuit-breaker measures for 10 percent swings.

The circuit breakers have also provided a new window into how often such extreme market moves happen. During periods of calm trading, like January of this year, circuit breakers were used infrequently: 14 times, according to data analyzed by Tabb. In contrast, they were used 51 times in December. The figures do not indicate how often the problems were because of the exchanges rather than other factors.

Christopher Nagy, the head of order routing at the retail broker TD Ameritrade, compared circuit breakers to brakes on a car. They are important, he said, but they become less effective as the car goes faster, as the market has in recent years.

“When you see any sort of market strife, you see chaos erupt,” he said.

The S.E.C. is considering introducing other measures to monitor the markets, like a new system, known as limit up-limit down, to halt extreme trades before they can be executed. But some market watchers say the agency has not been able to keep up with the increasing speed and complexity of the markets.

“We’ve managed over the past few years to equip the traders with Ferraris,” said Richard Bentley, the vice president for capital markets at Progress Software, which provides the industry with technology, “and the regulators are trying to keep up with them on bicycles.”

martedì 27 marzo 2012

L'I.P.O. di BATS: una discesa di nove secondi nell'abisso

Piccola rassegna stampa sul fallimento dell'I.P.O. di BATS:

Dal Wall Street Journal:
Trading Firm IPO Fizzles in Seconds
Apple Shares Also Affected as Glitch Mars Debut of BATS Global Markets
La S.E.C. ha detto di essere intenzionata a  capire cosa è successo:

The Securities and Exchange Commission said Friday it was looking at the BATS situation. "SEC staff has been and will continue to be in discussions with BATS to determine the cause and extent of the incident and steps BATS is taking to remedy the situation," an SEC spokesman said.

The day's events may rekindle questions about the reliability of the stock-market's plumbing, questions that came into sharp focus almost two years ago when the broader market plunged hundreds of points within minutes in what came to be known as the "flash crash."

"This shows the flaws in the current market structure," said Tim Quast, managing director of ModernIR LLC, a Denver company that advises public companies on market-structure issues. It demonstrates how fragile the market structure is" and highlights how vulnerable companies and investors are to computer glitches.

Trovate la cronaca del crash per esempio sul blog Deal Journal ospitato dal sito del WSJ
BATS Initial Public Tease: Nine Seconds of Free Fall

For BATS Global Markets, it took all of nine seconds for its IPO to crash.
The exchange operator stepped into the public’s view on Friday, March 23 at 11:14 and 18 seconds a.m. ET.
According to FactSet Research, the stock was trading at $15.25 with 1.2 million shares moving hands on the BATS exchange. That was down 4.7% from its pricing of $16, which had already been at the low end of its expected range of $16 to $18.
Within nanoseconds, the picture actually looked brighter.
Five trades, for a total of 800 shares, moved at $15.75 each, all of them on the Nasdaq exchange, according to the FactSet data.
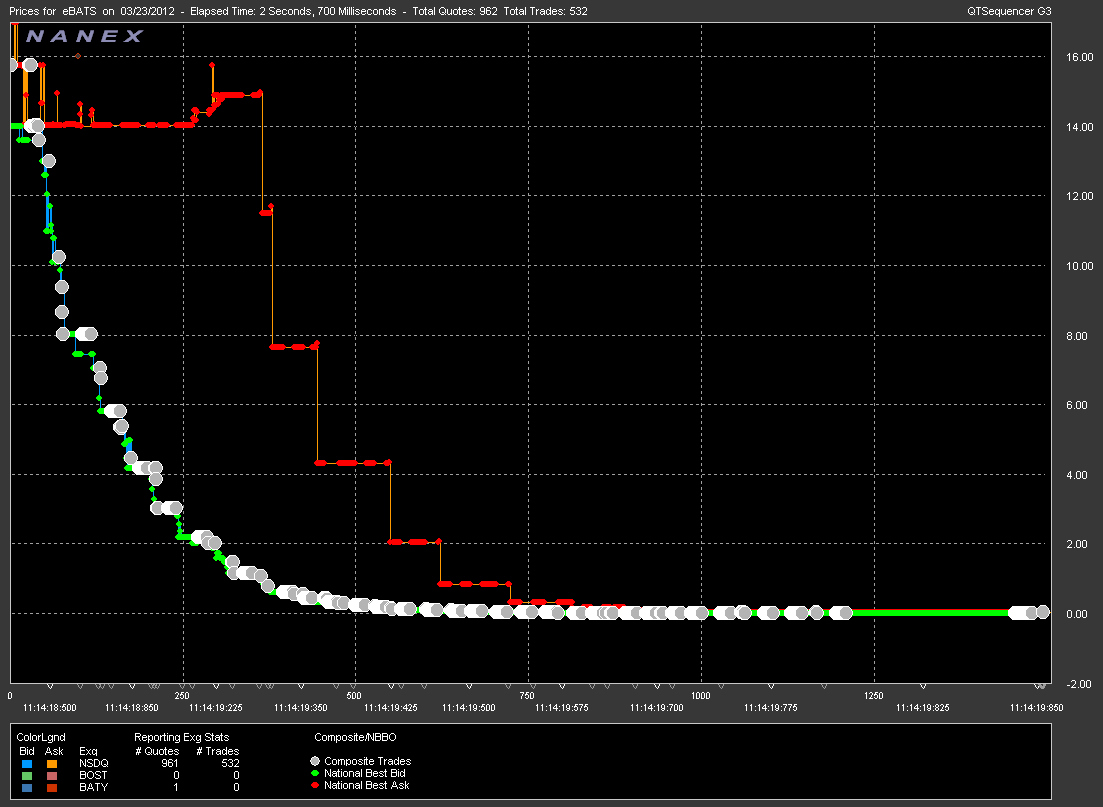
Then the stock started dropping, falling to $14 then to $13 before the bottom dropped out. The stock went quickly to $10.23, to $8.03 to $5.79 to $4.17 to $3.01 all before that first second of life was over.
In that time the difference between offers to buy and offers to sell spread from being a relatively close 50-cent spread to a difference of $11.23 as holders continued to look to sell at $14.90 a share.
The second second of life was not much better: $2.17 quickly became $1.15 which fell to 76 cents before plunging all the way down to 0.0002 cents. In total, 444 trades, all of 100 shares a piece, were made in that one second, everyone on the Nasdaq.
The sellers started dropping their asking prices though nowhere near as quick as the trading prices fell. The asks fell from above $14 to $11.50 to $7.64 to $4.31 to $2.05 before capitulating and falling below a dollar.
After that fall there appeared a slight breath of comparatively rationale thought: the next trade was made at 11:14 a.m. and 21 seconds for 3 cents a share.
Shares eventually climbed back to 4 cents at 11:14 a.m. and 27 seconds, the price that first appeared on some screens this morning and the last trade made.
At 11:14 a.m. and 33 seconds the stock was first listed as halted, back at $15.25.
But all that history will now be wiped out. BATS said the opening auction will be cancelled. On FactSet the company is back to $16.
Then the IPO was officially withdrawn.
It is unclear as of this time if mulligans do exist in IPOs, but BATS is going to try.


Nanex ha dedicato un post all'analisi dell'I.P.O. di BATS, e alla simultanea "transazione erronea" su Apple:


Nanex ~ The BATS IPO and halt in AAPL
The March 23, 2012 IPO of BATS was brief. The stock began trading at  11:14:18.475 with an initial price of $15.25. Within 900 milliseconds from opening the stock price had fallen to $0.2848. Within 1.5 seconds the price bottomed at $0.0002. 567 trades were executed before the stock was halted (532 are shown below).

Another curiosity: we found that starting around 10:45 and ending around 11:20, quotes from BATS stopped updating in all NYSE and Nasdaq symbols within a specific alphabetical range: between "A  " and "BECN ". The symbol BATS falls into this range.

venerdì 23 marzo 2012

Il flash crash di Apple e le indagini della SEC

Meno 9% in qualche secondo! Oggi Apple ha passato un brutto momento


Apple Flash Crash: Stock Halted After Trade Causes 9% Plunge


Shares of Apple, the world's most valuable company, plunged 9 percent on a single trade, causing it to be halted by the single stock circuit breaker rule because of volatility.
A single trade of 100 shares at a price of $542.80 hit the tape at 10:57 coming from the BATS Exchange. The previous trade seconds earlier was at a price of $598.26.
"It looks like a fat finger mistake," said Joe Terranova, chief market strategist for Virtus Investment Partners.
But there could be other factors involved. Nine minutes before the way out of market trade took place, BATS sent an alert stating, "Please be advised that BATS is currently investigating system issues trading in symbols range A through BF."
L'episodio viene proprio al momento giusto:  proprio in questi giorni si sta svolgendo l'I.P.O. di BATS ma la S.E.C. ha annunciato di voler capire un po' meglio cosa sta succedendo nel mondo dell'HFT
Federal securities regulators are examining whether some sophisticated, rapid-fire trading firms have used their close links to computerized stock exchanges to gain an unfair advantage over other investors, people familiar with the matter say.

The wide-ranging probe, being handled by the enforcement staff of the Securities and Exchange Commission, is focusing on the computer-driven trading platforms of exchanges, including BATS Global Markets Inc., the people said.
[BATSTRADE]

The SEC probe illustrates a bigger push by regulators to examine less-transparent parts of the securities markets, such as the fast-growing area of so-called high-frequency trading. High-speed trading firms use powerful computer systems for rapid-fire trades, in which they often hold stocks for only fractions of seconds. They benefit by being able to move quicker than less technologically proficient investors.

Computer-driven exchanges operated by firms such as BATS are the favored venue of high-speed trading firms. BATS has moved up to third in U.S. share-trading volume behind exchanges run by NYSE Euronext and Nasdaq OMX Group Inc., with about 11% of average daily volume.

BATS declined to comment.

The SEC probe stems partly from a broad look at computer trading that regulators initiated after the "flash crash" in May 2010, when stocks fell and rebounded sharply within minutes, following glitches in computer-trading systems.

As part of this effort, the SEC is looking at communications between exchanges and high-frequency trading firms. Investigators are examining whether firms collude to limit competition or manipulate markets, according to a person familiar with the matter.

lunedì 11 luglio 2011

Aggiornamento all'8 luglio 2011


La settimana è iniziata orfana delle borse U.S.A. che festeggiavano The Independence Day e priva di notizie di rilievo dall'Europa: la crisi del debito dei PIGS sembrava in standby e la sola notizia di rilievo era la bocciatura del piano francese di roll over del debito ellenico da parte di Standard & Poor’s. Secondo l'agenzia di rating la proposta francese è in realtà una malcelata  ristrutturazione del debito poichè gli obbligazionisti dovrebbero sottoscriverla malgrado perdite consistenti rispetto alle condizioni iniziali del loro investimento, facendo con ogni probabilità scattare il giudizio di default secondo i criteri di valutazione di S&P (dai quali dipendono i pagamenti dei CDS....Poi martedì le cose hanno iniziato a diventare più interessanti con la notizia del downgrade del debito portoghese da parte di Moody's al rango di junk (con un salto di ben quattro gradini, da Baa1 a Ba2) e con l'euro già indebolito che mercoledì mattina perdeva quasi l'uno percento in poco più di un'oretta! Un piccolo rimbalzo associato al preannunciato aumento dei tassi di 0.25% da parte della BCE è stato cancellato dalle vendite venerdì in concomitanza con una pessima giornata per Piazza Affari.
In Italia le banche hanno sofferto molto, con Unicredit che venerdì ha sperimentato quasi un mini-flash crash, con un crollo repentino di oltre 6 punti percentuali in una manciata di minuti prima di una provvidenziale sospensione delle trattative...Gli avvenimenti della settimana hanno molto preoccupato i commentatori e i regolatori, tutti sono arrabbiati con le agenzie di rating (ci sono buone ragioni per esserlo, da molti anni, quelle
addotte ora mi sembrano però più che altro strumentali), in molti hanno invocato la sospensione delle vendite allo scoperto dei titoli (che già ha dato pessima prova nell'ottobre del 2008) mentre altri ancora incolpano gli stress test (l'idea è sempre la stessa: se uno ha un febbrone da cavallo per curarlo si butta via il termometro).

Dall'altra parte dell'oceano venerdì ha esposto ancora una volta la cronica debolezza del mercato del lavoro americano. Nella sua ultima lettera settimanale John Mauldin non è molto ottimista: in particolare è parecchio critico nei confronti della politica europea, e Dio solo sa come si esprimerebbe su quella di casa nostra...Il default della Grecia è dato per scontato così come il conseguente effetto domino:


The economy will already be slowing down. A recession in 2012 is a real possibility if 
there is any type of shock coming from Europe, and what will happen there is anyone’s guess. I 
think most European leaders are basing their thinking more on hope than on reality. When 
Greece defaults there will be a domino effect; you can count on it. And you could actually see a 
banking crisis before we get actual sovereign defaults.
Gentle reader, you need to understand that the market does not get it. Neither in Europe 
nor in the US. When someone says the market has already priced in a default, go back and ask 
them how well the market priced in a crisis in the spring of 2008. The market doesn’t know jack.
I got a lot of internet buzz from a throwaway line in an interview on CNBC in London. I 
said that if the market knew what Bernanke and the leadership of the central banks talked about 
after their third glass of wine, the market would wet its pants. That is not to suggest I don’t think 
Bernanke or Trichet can hold their liquor. It means that they get the problem more than they let 
on in public and are simply trying to stem as much damage as they can.
Banking crises are followed by credit crises by 2-3 years. It is getting close to that time. 
We need 3-3.5% GDP growth in the US to really make a dent in jobs. We are not going to get it. 
There is nothing we can do other than Muddle Through as best we can. Prepare accordingly.


Il punto di vista di Mauldin non è molto distante da quello dell'Economist che questa settimana dedica un'editoriale al deleveraging e alle sue conseguenze.


L'indice Eurostoxx ha chiuso la settimana in ribasso -2.3%, l'euro ha perso l'1.8% sul dollaro.Negative anche le obbligazioni europee trentennali (-0.3%). Tutt'altra musica invece per l'indice S&P500 (+2.2% in euro),  l'indice immobiliare (+3.5% in euro) e quello di materie prime (il migliore della settimana con un +3.9% in euro).
La strategia top2 gudagna lo 0.2% e la top3 fa ancora meglio +1.3%.: il drawdown della strategia top2 dal massimo di diciassette settimane fa è pari al 10.9%; il drawdown della top3 dal massimo del 7 gennaio 2011 è  pari al 4.2%.

Le strategia top2 con copertura del rischio di cambio segna un progresso pari allo +0.9% mentre la top 3 cede lo 0.2%. Se la copertura fosse stata effettuata da quando il 14 gennaio 2011 la tendenza di medio periodo dell'euro è diventata positiva avrebbero reso rispettivamente il +2.1% e +4.2%. 

Questa settimana l'ordine in classifica degli asset vede gli indici S&P500 e l'indice FTSE EPRA-NAREIT Global sorpassare il cambio euro/dollaro e insidiarsi alla prima posizione ex-aequo. Al quarto posto l'indice di materie prime CRB mentre la correzione in atto in Europa penalizza l'indice  EuroStoxx che occupa la quinta posizione con la tendenza di medio periodo che diventa negativa. Maglia nera alle obbligazioni trentennali dell'eurozona.
La  strategia top 2 suddivide quindi il capitale equipesando l'indice S&P500 e  l'indice FTSE EPRA-NAREIT Global. La  top 3 aggiunge al paniere anche il cambio euro/dollaro. Chi volesse utilizzare le due strategie con la copertura del rischio di cambio utilizzando una leva 3x per il cambio può costruire un portafoglio in questo modo:

top2: 37.5% FTSE EPRA-NAREIT, 37,5% S&P500, 25% copertura cambio (nessuna variazione rispetto alla scorsa settimana)
top3: 25% FTSE EPRA-NAREIT, 25% S&P500 25% indice CRB e 25%  copertura cambio 

E' anche possibile includere il cambio euro/dollaro nel portafoglio, speculando su un ulteriore rialzo. In questo caso, sempre utilizzando una leva 3x per il cambio, il portafoglio top2 rimane invariato mentre il portafoglio top3 diventa

top3: 33.3% S&P500, 33.3% FTSE EPRA-NAREIT e 33.3% cambio euro/dollaro in leva 3x (di cui 22.2% per copertura e 11.1% di posizione al rialzo)

L'indice obbligazionario a lungo termine così come l'indice EuroStoxx hanno la tendenza di breve periodo e quella di medio periodo entrambe negative. Il cambio euro/dollaro ha la tendenza di medio periodo positiva ma quella di breve termine negativa

In questo post trovate le risposte ad alcune delle domande  più frequenti relative alla metodologia che utilizzo per la costruzione della tabella e dei portafogli che aggiorno settimanalmente.

In questo post ho descritto quali ETF negoziati a Milano  replicano (in positivo o in negativo) gli indici che sono settimanalmente tracciati qui su Alfaobeta. Se volete fare delle analisi da soli, in questo post ho spiegato come procurarsi gratuitamente le serie storiche dei prezzi e dei NAV degli ETF mentre qui potete trovare qualche informazione sui costi di transazione nel mercato dei cambi.

Dall'inizio del 2011 il rendimento (valutato in euro) di un portafoglio che ogni settimana investe nei primi 2 asset (top2) della tabella è pari al -9%, se investito nei primi tre asset (top3) il rendimento è stato del  -2%. Nell'intero 2009 le stessa strategie avevano reso rispettivamente il 12.2% e il 2.4% e nel 2010 il 22.4% e il 18.2%.

Nella figura è raffigurato l'andamento di un euro investito nelle due strategie dal 3 gennaio 2009 ad oggi.


Il rendimento annuale composto della strategia top2 è del 9.4%, con una volatilità del 12.1%, un massimo drawdown del 12.8% e un indice di Sharpe di circa 0.7.

Il rendimento annuale composto della strategia top 3 è pari al 6.9%, con una volatilità dell'11.8%, un massimo  drawdown del 15.1% e un indice di Sharpe pari superiore a  0.4.

La strategia che investe nei primi due asset a condizione che la tendenza di medio periodo sia positiva, e in contanti nel caso contrario, ha reso nell'intero 2009 il 13.9%. Nel 2010 ha coinciso con la top2 con l'eccezione di due sole settimane (questa e questa): la performance complessiva per il 2010 è stata leggermente peggiore della top2, con un +18.6%.

La strategia che semplicemente investe in parti uguali in tutti e 6 gli asset seguiti settimanalmente da Alfaobeta
ha chiuso la settimana con un +0.9%, riavvicinandosi al massimo raggiunto dieci settimane fa: il drawdown è ora pari all'1%.  La strategia ha reso nel 2010 il 12.6% con una volatilità del 10% mentre dall'1 gennaio 2009 ad oggi ha reso il 34% con un massimo drawdown del 14.8%. Il rendimento dal primo  gennaio 2011 è stato pari all'1.4%. Il portafoglio top2 ha reso il 25.4% dall'1 gennaio 2009 a oggi, con un massimo drawdown del 12.8%: l'ultimo massimo è stato raggiunto il 7 marzo scorso e da allora il drawdown è pari all'10.9%. Il rendimento del portafoglio top2 dal primo gennaio 2011 a oggi è stato pari al -9%.
La strategia che settimanalmente investe il capitale dividendolo in parti uguali negli asset che hanno una tendenza di medio periodo positiva (una versione più aggressiva della strategia di Faber che invece ripartisce il   capitale tra liquidità e gli asset con tendenza di medio periodo positivo) ha chiuso questa settimana con un +1.1%. Nel 2010 ha avuto un rendimento pari al 12.1% e da inizio 2009 ad oggi ha reso il 26.2%, con un massimo drawdown inferiore al 7%. La volatilità è ben inferiore al 10%.  Il rendimento dal primo gennaio 2011 a oggi è stato pari al +0.8%.

E' bene ricordare che i rendimenti calcolati non tengono neppure conto dei costi di transazione e del prelievo fiscale. Mi preme comunque sottolineare che le analisi e le simulazioni descritte in questo blog sono da considerarsi sempre e comunque risultati teorici e relativi al passato. Chiunque decidesse di utilizzare le strategie descritte o qualsiasi altra informazione tratta da questo blog per decisioni di investimento se ne assume completamente la responsabilità.

Ecco l'aggiornamento all'8 luglio 2011.

giovedì 19 maggio 2011

Il calcolo della velocità?

Si parla di high frequnecy trading e di flash crash oggi su Nova , il supplemento di scienza e tecnologia del Sole 24 Ore. L'icona scelta per il servizio e' la farfalla dell'attrattore di Lorenz...sono contento che i sistemi dinamici contribuiscano alla costruzione dell'immaginario collettivo! Qui potete leggere l'articolo di Lops e Larizza dedicato al trading ad alta frequenza. Del flash crash invece ci occupiamo Fabrizio Lillo ed io in un articolo di cui vi riproduco l'incipt...

«Noi affermiamo che la magnificenza del mondo si è arricchita di una bellezza nuova; la bellezza della velocità»: così scriveva Marinetti nel «Manifesto del Futurismo», all'alba del XX secolo. L'esaltazione della tecnica e della velocità oggi caratterizza più la finanza che l'arte. Nel primo decennio del XXI secolo i mercati finanziari hanno infatti abbracciato piattaforme tecnologiche che consentono agli scambi di avvenire migliaia di volte al secondo. Per poter sfruttare sofisticate strategie di trading ad alta frequenza (Hft, acronimo di high frequency trading) è necessaria la collocazione fisica dei computer in prossimità dei mercati e impiegare algoritmi ad altissime prestazioni per identificare piccole anomalie nei prezzi ed eliminarle il più rapidamente possibile. Il profitto ottenuto da ogni singola transazione è di solito assai magro, ma l'enorme numero di compravendite rende il business molto profittevole. È raro che una posizione sia mantenuta per tempi superiori ai pochi minuti: secondo alcune analisi negli Usa un'azione viene rivenduta in un tempo medio di 22 secondi. Anche se l'Hft è usato solo dal 2% delle società mobiliari Usa, queste sono tuttavia responsabili di oltre il 70% del volume azionario negli Usa e del 40% in Europa. Questi numeri sono inferiori ma in forte crescita su altri beni finanziari.

...il resto lo trovate qui.

mercoledì 11 maggio 2011

I mercati instabili e il trading ad alta frequenza

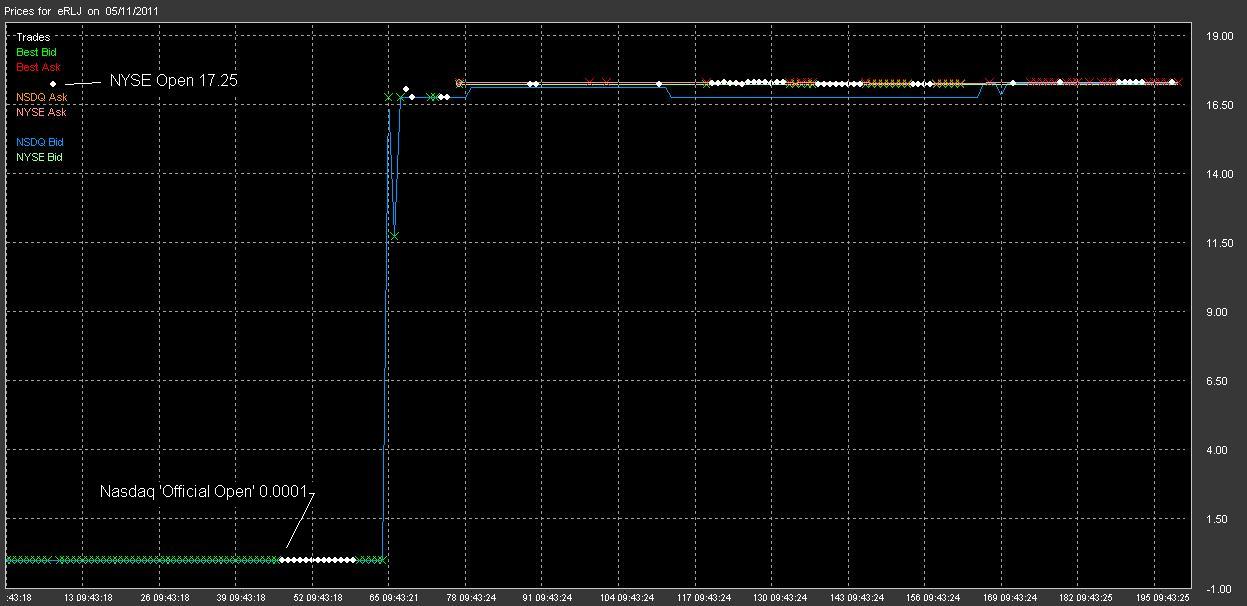
Continuano le sorprese: oggi, al suo primo giorno di quotazione sul New York Stock Exchange, RLJ ha 
aperto a 17 dollari ma poi è stata ripetutamente scambiata a 1 centesimo (!!!)


Le transazioni sono state cancellate un paio di ore dopo.

Se vi interessano questi argomenti e volete approfondirli un buon punto di partenza potrebbero essere le presentazioni della giornata di studio che alla Scuola Normale abbiamo dedicato al flash crash del 6 maggio 2010: potete trovarle a questi link:


STEFANO MARMI
Scuola Normale Superiore, Pisa

FULVIO CORSI
Università della Svizzera Italiana, Lugano

FABRIZIO LILLO
Scuola Normale Superiore, Pisa, Università di Palermo e Santa Fe Institute, Santa Fe

GIACOMO BORMETTI
Scuola Normale Superiore, Pisa e INFN, Pavia

Wednesday May 11 2011, 14.00 - 16.00 Aula Bianchi

martedì 10 maggio 2011

Come evitare un nuovo flash crash ?

Dal sito del Financial Times, due video sul flash crash (ringrazio Andrea Pirino per la segnalazione) che prensentano due punti di vista autorevoli ma forse un po' troppo rassicuranti, ricordando a tutti la giornata di studio che dedicheremo all'argomento domani alla Scuola Normale:


Flash crash 'was best possible thing'

May 5 2011  A year on from the precipitous plunge of the Dow Jones that wiped $1,000bn from the US stock market in a matter of minutes, Jeremy Grant, FT Trading Room editor, talks to the FT's Seb Morton-Clark about the causes of the crash and the measures that have been taken to prevent a repeat of events.  (6m 2sec)

Year later trader says 'flash crash' addressed
May 5 2011  Jose Marques, the global head of electronic equity trading at Deutsche Bank tells the FT's Telis Demos that regulators have addressed many deficiencies in market structure since the 'flash crash' on May 6th of last year. But Mr Marques says more controls are needed to stop unforeseen future disruptions before they occur  (6m 22sec)
Su come prevenire instabilità come quelle del 6 maggio 2010 vi segnalo inoltre questo articolo sul New York Times che lancia accuse molto circostanziate sulla S.E.C.. Infine un altro video, dal WSJ, nel quale si osserva correttamente come massive stock slumps such as the "flash crash" can't be prevented and remain a rare, but consistent feature of all stock markets.


"Incidenti" simili al flash crash sono in realtà diventati relativamente frequenti anche in mercati diversi da quello azionario. Secondo il WSJ The U.S. dollar sank 5% against the Japanese yen within minutes on March 16, one of its biggest moves ever. Also that month, cocoa-futures prices dropped 13% in just seconds on the IntercontinentalExchange Inc. before rebounding almost as quickly. In February, the sugar market took a dive of 6% in just one second.
Like the stock market "flash crash," which occurred a year ago on Friday, these big moves are the unintended consequences of an influx of high-frequency and algorithmic traders into markets that aren't equipped to deal with them.(...)
The timing of some of these mini crashes shows the impact of computerized trading. The dollar tumbled against the yen at 5 p.m. in New York on March 16, right as several major banks had shut down their electronic-trading programs as part of a routine handoff to colleagues in Asia, when a barrage of buy orders for the currency stormed the market. With few traders around, the orders, combined with forced buying linked to options, were set loose into a void.
Cocoa's flash crash came at about 10:30 a.m. New York time on March 1, after orders to sell hundreds of cocoa contracts flooded the market. Too few buy orders were there to soak up the sale. Cocoa plunged $450 in one minute, to a low of $3,217 a metric ton. The sell orders were unusually large for the cocoa futures market, which typically handles about 20,000 contracts a day.