Visualizzazione post con etichetta materie prime. Mostra tutti i post

domenica 8 maggio 2011

Il boom delle materie prime e dell'euro...Aggiornamento al 6 maggio 2011

...questa settimana è diventato uno sboom! Dopo un inizio di settimana in modesto rialzo e dopo il bailout del Portogallo di mercoledì, il cambio euro/dollaro (vedi figura qui accanto) è crollato in due giorni da 1,49 a poco più di 1,43, sepolto dalle vendite su voci di ristrutturazione del debito della Grecia.
 
E' stato sufficiente un articolo sul settimanale tedesco Der Spiegel per mettere in moto la fuga dall'euro: secondo il WSJ la fuoriuscita della Grecia dall'eurozona sarebbe un disastro:
Even if it is simply a negotiating ploy, talk of Greece giving up the euro raises sovereign-debt problems that could weigh on the common currency in the near term—re-igniting fears that had dissipated in recent weeks as the euro has surged.
"The potential disastrous result that would occur from such a pullout is the gun to the head of the EU/IMF to soften and extend the terms," of Greece's current financial assistance, said Andy Busch, global foreign exchange strategist at BMO Capital Markets in Chicago. "For the markets, there is no choice but to sell the euro currency, the European financial stocks and European debt to cover the potential massive losses that would occur."
The sharpness of the euro's fall could be explained by how heavily the market had bet the euro would continue its rise. The Commodity Futures Trading Commission on Friday released data indicating a 48% jump in long positions on the common currency, or wagers that the euro would increase in value. The data were compiled as of Tuesday, days before the euro's downturn. The currency's decline may have been accelerated by investors unwinding those bets.

Sulla fragilità dell'eurozona e sulle conseguenze che la ristrutturazione del debito greco avrebbe per il sistema bancario europeo vi consiglio di leggere il commento di Martin Wolf sul Financial Times di martedì scorso e questo articolo del New York Times.   Secondo Wolf la migliore via d'uscita dalla crisi dell'eurozona è un rilancio del movimento verso una più stretta integrazione politica, economica e finanziaria. Sono d'accordo con lui ma osservando la dinamica dall'Italia mi viene da essere scettico sulle possibilità di riuscita.

La crisi dell'euro si è accompagnata alla caduta delle materie prime, anticipata dal crollo dell'argento che ha perso il 30% in una manciata di giorni. Un ribasso impressionante che ha riportato alla mente dei commentatori più anziani la caduta dopo il tentativo dei fratelli Hunt di manipolare il mercato tra il 1973 e il 1980. Vi consiglio la lettura di un lungo articolo sul Wall Street Journal per ripercorrere la storia delle bolle speculative nell'argento.

Ci sono però buone ragioni per pensare che l'era delle materie prime a buon mercato appartenga al passato e non torni più: Jeremy Grantham di GMO ha dedicato il suo ultimo commento al mercato a questo argomento e ve ne consiglio la lettura. I movimenti violenti dei cambi e delle valute hanno contribuito a rendere la settimana decisamente interessante e poco noiosa, ma ahimè anche poco profittevole per i portafogli di Alfa o Beta?


L'indice di materie prime CRB ha perso il 9% in dollari, un crollo verticale leggermente ammorbitito per gli investitori europei dal recupero del dollaro (+3.4%) che mitiga la discesa dell'indice CRB in euro a -5.8%. Negativo anche l'indice Eurostoxx che ha chiuso la settimana con un -1.4%.  Tutti gli altri asset seguiti settimanalmente da Alfa o Beta? hanno chiuso la settimana positivamente: l'indice S&P500 in euro ha guadagnato l'1.7%,  l'indice immobiliare globale ha segnato un +1.6% in euro mentre le obbligazioni governative trentennali dell'eurozona proseguono il tentativo di ripresa in atto da un mese con un progresso dello +0.5%.
Questa settimana la strategia top2 perde il 4.6% e la top3 perde il 2.5%: il drawdown della strategia top2 dal massimo di otto settimane fa è pari all'8.2%; il drawdown della top3 dal massimo del 7 gennaio 2011 è  4.1%.

La settimana scorsa osservavo come la debolezza del dollaro abbia  grandemente penalizzato i rendimenti della top2 e della top3, che non coprono il rischio cambio quando sono investite in asset denominati in dollari, pur misurandone la forza relativa in quella valuta. Il recupero messo a segno questa settimana non cancella queste considerazioni: le strategie top2 e top3 con copertura del rischio di cambio effettuata da quando il 14 gennaio 2011 la tendenza di medio periodo dell'euro è diventata positiva avrebbero reso rispettivamente il +2.5% e +4.2%. Osservavo poi come "la forza relativa dell'euro in questo momento è tale che potrebbe essere saggio aspettare una correzione di almeno il 3-4%": la correzione non si è fatta aspettare e se decidete di coprire il cambio questo potrebbe essere un buon momento per iniziare a farlo. Vi raccomando il post della scorsa settimana per un commento sulle diverse strategie che si possono implementare.

Il crollo dell'euro e delle materie prime hanno portato a cambiamenti importanti nella classifica: al primo posto ora è l'indice S&P500 davanti al cambio euro/dollaro mentre l'indice CRB è scivolato al terzo posto:  il portafoglio della strategia top2 si divide quindi in parti uguali tra indice S&P500 e cambio euro/dollaro mentre il portafoglio top3 investe in parti eguali in materie prime, indice S&P500 e cambio euro/dollaro.Chi volesse utilizzare la strategia con la copertura del rischio di cambio utilizzando una leva 3x per il cambio può costruire un portafoglio in questo modo:

top2: 37.5% S&P500, 37,5% CRB, 25% copertura cambio
top3: 25%    S&P500, 25% CRB, 25% FTSE EPRA-NAREIT, 25% copertura cambio

La settimana scorsa i due portafogli costruiti in questo modo hanno reso rispettivamente -6.5% e -5.6%. Sono contento di aver raccomandato di aspettare una correzione nel cambio euro/dollaro prima di iniziare a implementare un'eventuale copertura!

L'unico asset con tendenza a medio termine negativa sono le obbligazioni governative europee a scadenza trentennale ma segnalo come la tendenza a breve termine sia ora positiva mentre la tendenza a breve termine del cambio euro/dollaro e delle materie prime è ora negativa.

In questo post trovate le risposte ad alcune delle domande  più frequenti relative alla metodologia che utilizzo per la costruzione della tabella e dei portafogli che aggiorno settimanalmente.

In questo post ho descritto quali ETF negoziati a Milano  replicano (in positivo o in negativo) gli indici che sono settimanalmente tracciati qui su Alfaobeta. Se volete fare delle analisi da soli, in questo post ho spiegato come procurarsi gratuitamente le serie storiche dei prezzi e dei NAV degli ETF mentre qui potete trovare qualche informazione sui costi di transazione nel mercato dei cambi.

Dall'inizio del 2011 il rendimento (valutato in euro) di un portafoglio che ogni settimana investe nei primi 2 asset (top2) della tabella è pari al -6.2%, se investito nei primi tre asset (top3) il rendimento è stato del  -1.9%. Nell'intero 2009 le stessa strategie avevano reso rispettivamente il 12.2% e il 2.4% e nel 2010 il 22.4% e il 18.2%.

Nella figura è raffigurato l'andamento di un euro investito nelle due strategie dal 3 gennaio 2009 ad oggi.


Il rendimento annuale composto della strategia top2 è del 11.7%, con una volatilità del 12.3%, un massimo drawdown del 8.2% e un indice di Sharpe superiore a 0.8.

Il rendimento annuale composto della strategia top 3 è pari al 7.6%, con una volatilità del 12%, un massimo drawdown del 15.1% e un indice di Sharpe poco inferiore a  0.5.

La strategia che investe nei primi due asset a condizione che la tendenza di medio periodo sia positiva, e in contanti nel caso contrario, ha reso nell'intero 2009 il 13.9%. Nel 2010 ha coinciso con la top2 con l'eccezione di due sole settimane (questa e questa): la performance complessiva per il 2010 è stata leggermente peggiore della top2, con un +18.6%.

La strategia che semplicemente investe in parti uguali in tutti e 6 gli asset seguiti settimanalmente da Alfaobeta
ha chiuso la settimana con una perdita dell'1.1% allontanandosi così dal massimo raggiunto la settimana scorsa. La strategia ha reso nel 2010 il 12.6% con una volatilità del 10% mentre dall'1 gennaio 2009 ad oggi ha reso il 33.6% con un massimo drawdown del 14.8%. Il rendimento dal primo gennaio 2011 è stato dell'1%. Il portafoglio top2 ha reso il 29.3% dall'1 gennaio 2009 a oggi, con un massimo drawdown dell' 8.2%: l'ultimo massimo è stato raggiunto il 7 marzo scorso e da allora il drawdown è proprio pari all'8.2%. Il rendimento del portafoglio top2 dal primo gennaio 2011 a oggi è stato pari al -6.2%.
La strategia che settimanalmente investe il capitale dividendolo in parti uguali negli asset che hanno una tendenza di medio periodo positiva (una versione più aggressiva della strategia di Faber che invece ripartisce il capitale tra liquidità e gli asset con tendenza di medio periodo positivo) ha chiuso questa settimana con un -1.5% anch'essa abbandonando il massimo storico raggiunto la scorsa settimana. Nel 2010 ha avuto un rendimento pari al 12.1% e da inizio 2009 ad oggi ha reso il 26.5%, con un massimo drawdown inferiore al 7%. Il rendimento dal primo gennaio 2011 a oggi è stato pari al +1.3%.

E' bene ricordare che i rendimenti calcolati non tengono neppure conto dei costi di transazione e del prelievo fiscale. Mi preme comunque sottolineare che le analisi e le simulazioni descritte in questo blog sono da considerarsi sempre e comunque risultati teorici e relativi al passato. Chiunque decidesse di utilizzare le strategie descritte o qualsiasi altra informazione tratta da questo blog per decisioni di investimento se ne assume completamente la responsabilità.

Ecco l'aggiornamento al 6 maggio 2011.

martedì 18 gennaio 2011

La Grande Convergenza e i giochi a somma zero

Buttonwood si preoccupa dell'aumento dei prezzi delle materie prime in una fase così precoce della ripresa economica dopo la Grande Recessione del 2008-2009:

The strength of raw-materials prices raises three vital questions. Given that the global recovery is at a very early stage, do high prices indicate that the world faces significant supply constraints, which will be a problem for years to come? Will such constraints lead to prolonged inflationary pressures and cause central banks to tighten monetary policy? Or are high prices simply a bubble, the result of speculative activity in the futures markets? 

La speculazione è un fattore non trascurabile ma non è sufficiente per spiegare il fenomeno. Una spiegazione migliore sembra debba tenere conto del quantitative easing:

Studies have shown that commodities that are not traded on exchanges have tended to rise as fast, and be as volatile, as those that are.
In any case, it seems likely that investors and commodity consumers are motivated by the same factors. Prices rebounded in the second half of 2010 after clear hints from the Federal Reserve that it would pursue a second round of quantitative easing. That might have caused speculators to pile into the market; it might equally have prompted companies in America and elsewhere to stop worrying about an economic double dip and to start rebuilding their inventories.
Over the long run, investing in commodities has not been a great bet. Companies use the term “commodity business” to describe humdrum, low-margin activities. In real terms The Economist’s commodity-price index has gone backwards since 1862, falling by around half since then. People have become more efficient at growing, finding or refining raw materials. As Dylan Grice, a strategist at Société Générale, remarks: “When you buy commodities, you’re selling human ingenuity.”
One would expect commodities to be anchored by the cost of production. A market price well above that level will cause new supply to be brought on stream; too low a price will cause mines to be mothballed or arable land to be switched to other crops. In turn, the cost of production is cyclical since it requires a good deal of other commodities (such as oil) in the process. Higher grain costs, for example, feed through into cattle prices.
Clearly, at the top of the economic cycle, consumers will be so desperate to get their hands on raw materials that they will pay well over the cost of production. So the current surge in commodity prices, at a time of spare economic capacity in the rich world, suggests one of two things is going on. Either the needs of the developing world are causing demand growth to outstrip supply for an extended period, or new sources of supply can be found only at higher cost. Both explanations add weight to the idea of a “commodity supercycle”, a long-term surge in prices that might last for 15-20 years.
In the short term this is bad news for the developed world which, in aggregate, is a commodity consumer, not producer. Higher prices may cause a surge in headline inflation but their main effect will be to act as a tax on consumers. For many parts of Europe, this tax is being levied at a time when the spending power of consumers is already being squeezed by the efforts to eliminate the fiscal deficit. (...) If the Chinese economy slowed sharply, then commodity prices would slump. But that is not an outcome that the developed world should hope for.

La questione dell'aumento vistoso dei prezzi delle materie prime si ricollega alla Grande Convergenza tra paesi sviluppati e paesi in via di sviluppo di cui va scrivendo Martin Wolf sul Financial Times da un paio di settimane a questa parte:
secondo Wolf, che cita uno studio dell'OCSE,  convergence has been changing the global balance of supply and demand for resources.** This is shown in recent rises in the real prices of metals and energy. The International Energy Agency points out that global primary energy demand could rise by another 50 per cent by 2035. Without a big change in the energy intensity of production, that is what the economic convergence we see has to mean: if all of humanity used the same energy per head as the rich countries do today, consumption of commercial energy would be three times what it is now (see charts).(...)
 
The biggest challenges arise where zero-sum outcomes are more likely. Resources are a big example. Political power is another. A rising east must alter the balance of global power and the abundance of cheap resources.
On the latter, it is an irony of intellectual history that Thomas Malthus, prophet of overpopulation, worried about the lack of resources just as these pessimistic assumptions became untrue. The biggest question of the 21st century may be whether resources prove to be binding constraints once again, as they so often proved to be, prior to 1800. Will ingenuity continue to overcome scarcity, or not? If the answer is “yes”, all of humanity might come to enjoy the historically unprecedented lifestyles of today’s most favoured people. If the answer is “no”, we might, instead, fall prey to what Prof Morris calls the “five horsemen of the apocalypse” – climate change, famine, state failure, migration and disease. Moreover, even if these problems are soluble, it may take a far higher level of political co-operation than is available to do so. This is particularly true where economic growth creates global externalities, climate change being the biggest challenge of this kind. This is not being managed. Political developments lag today’s reality.
The same is true of power politics. Now that we have the capacity to destroy civilisation, relations among powerful states have become perilous. After the use of the atomic bomb, Albert Einstein argued that “the only salvation for civilisation and the human race lies in the creation of world government”. Einstein was condemned as naive but his comment might still be true.
The “great convergence” is an epoch-making transformation. It is the spread of the energy-abundant economy to much of humanity. But if we do not manage the consequent pressure on resources, it may end in misery; and if we do not manage the shifts in power, it may end in war. One of Prof Morris’s most optimistic views is that each age gets the thought it needs. Given the speed of change, will it come soon enough?

venerdì 7 gennaio 2011

Un rapporto prezzo/ricavi un po' gonfiato?

Linkedin sta preparando la quotazione in borsa: ne parlano il New York Times 
e il Wall Street Journal. Linkedin ha 85 milioni di utenti registrati, cresce al ritmo di 30-35 milioni di utenti all'anno e ha una valutazione implicita dagli scambi sui mercati OTC di circa 2 miliardi di dollari. Forse i 50 miliardi di valutazione per Facebook - con circa 500 milioni di utenti e tassi di crescita confrontabili, potete leggere un po' di dati statistici su Facebook qui - sono un po' gonfiate...apparentemente la pensa così anche l'Economist appena stampato dal quale ho tratto la figura qui sotto, che ho trovato irresistibile...
Secondo il settimanale inglese il rapporto prezzo/ricavi implicito nella valutazione di Facebook è 25...Sembra di essere tornati nei ruggenti anni Novanta!

Facebook’s implicit value has risen fivefold since mid-2009, but sceptics doubt that a firm whose business model is unproven is worth more than established media giants such as Time Warner (...) at $50 billion Facebook looks rather expensive. If its sales really are $2 billion a year, that implies that Goldman and DST are paying 25 times current revenues for their shares. That would be a breathtakingly steep multiple, even by the giddy standards of the start-up world. 

L'articolo poi prosegue analizzando le richieste di informazioni da parte della S.E.C. sugli investors pools coinvolti nell'acquisto di una quota di Facebook e sui mercati OTC sui quali sono scambiate azioni di Facebook e di altri social networks. Ulteriori notizie sulle preoccupazioni della S.E.C. le trovate in questo articolo del NYT.

martedì 4 gennaio 2011

Meglio il cotone del Dow Jones!

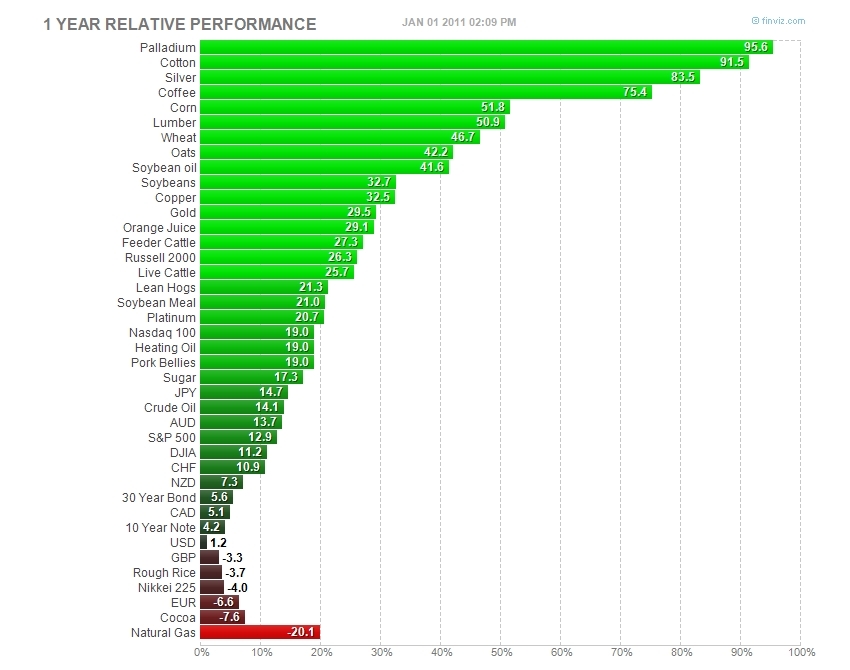
Nel 2010 i prezzi del cotone e del palladio sono quasi raddoppiati (in dollari USA, in euro si può sopprimere il quasi).

I rendimenti azionari impallidiscono se confrontati con il poderoso rimbalzo delle materie prime. Anche in una prospettiva storica il 2010 è stato un anno buono per le azioni U.S.A., ma niente di più:  l'istogramma qui accanto riassume i rendimenti delle azioni U.S.A. nei 186 anni dal 1825 a oggi: nel 70% dei casi i rendimenti sono stati positivi. Nel ventennio 1980-1999 solo due anni hanno avuto rendimenti (moderatamente) negativi mentre in ben 11 casi i rendimenti sono stati superiori al 20%. Tutt'altra musica nei dodici anni successivi: ben quattro gli anni con rendimenti negativi (anche pesantemente negativi come nel caso del 2002 e del 2008) e solamente nel 2003 e nel 2009 la borsa U.S.A. si è coraggiosamente spinta oltre il +20%. Infine è dal 1958 che non si vede un anno con un rendimento superiore al 40%.

martedì 28 dicembre 2010

E se Mr. Copper avesse cattive intenzioni?

Il Wall Street Journal ci informa che circa il 90% del rame fisicamente disponibile per la negoziazione sul mercato Londinese è in mano a una sola persona, che confidenzialmente chiameremo Mr. Copper. Secondo il WSJ anche altri metalli industriali sono stati accumulati da singoli traders:

Single traders also own large holdings of other metals. One trader holds as much as 90% of the exchange's aluminum stocks. In the nickel, zinc and aluminum alloy markets, single traders own between 50% to 80% of those metals and one firm has 40% to 50% of the LME's tin stockpiles.

C'è dunque un club molto esclusivo a Londra, dove forse si incontrano Mr. Copper con i suoi pari, Mr. Aluminium, Mr. Nickel, e così via.

Questa estate ho letto un classico della letteratura dedicata al trading, Reminiscences of a Stock Operator di Lefèvre che narra le gesta di Jesse Livermore, il leggendario speculatore attivo tra la fine dell'Ottocento e gli anni Trenta del secolo scorso. Il racconto è pieno di episodi di manipolazione dei mercati e di tentativi di market cornering .
Questa sembra essere la principale preoccupazione delle autorità che controllano i mercati delle materie prime:

While commodities exchanges scrutinize all holdings to ensure a single player isn't trying to corner the market, and many of the positions are owned by big firms on behalf of clients, the large holdings do result in a concentration of ownership that could skew prices. (...)
While commodities regulators in the U.S. are considering restricting the amount of futures contracts any one trader can hold, they have no jurisdiction over physical holdings.
The LME has strict rules to prevent market squeezes but does not limit how much metal a single trader may hold. Instead, the exchange demands the dominant holder make metal available for short-term periods at very limited profit margins. The LME says it closely watches individual holdings.

Ma oltre alla possibilità di manipolazione dei prezzi, se si tiene conto che già il 97% delle terre rare è controllato da un solo paese e che il rame è uno dei metalli più sensibili al ciclo economico (tanto da essere a volte soprannominato come il metallo con un Ph.D. in economia), è possibile immaginare uno scenario fantapolitico da brivido...


Last month, the LME reported that a single holder owned more than 50% of the exchange's copper. People familiar with the matter at the time said J.P. Morgan was the holder. On Tuesday, the LME reported that a single holder now has as much as 90% of the stockpiles, without naming the firm. The LME reports data two days in arrears, so the position increased on Friday.
In the aluminum market, about 70% of the LME metal is locked up, MF Global base metals analyst Edward Meir said during LME Week in London in October.

venerdì 15 ottobre 2010

La guerra delle valute, il quantitative easing e il prezzo del grano

L'Economist appena uscito dedica la copertina alla guerra delle valute, insieme a due articoli di commento che potete leggere quiqui.
Il tema dei cambi si intreccia con quello del quantitative easing promesso dalla Fed per sostenere una crescita U.S.A. che non riesce a creare occupazione.


Ma nessuno sa se lo scopo che la Fed si prefigge sia realistico:  qui    potete leggere l'opinione dell'Economist sull'argomento, mentre qui  trovate un articolo del Wall Street Journal che ancora una volta mette in guardia gli investitori sui rischi associati alle obbligazioni con lunga scadenza, se l'inflazione dovesse finalmente fare di nuovo capolino, e con essa un rialzo dei tassi. Scrive il WSJ: 

Of course, quantitative easing mightn't succeed in triggering core price inflation, at least in the short term. The impact may be simply to inflate the price of financial-sector assets and commodities, rather than driving activity in the real economy. Over time, policy makers seem to hope that asset-price inflation will boost confidence and encourage risk-taking. They ultimately have the power to generate inflation if they choose and seem willing to err on the side of doing too much rather than too little.
The policy carries huge risks. But price rises for gold and inflation-linked bonds suggest a return to inflation is starting to be baked in. Tipping the balance toward inflation should boost the allure of equities as real assets over bonds as nominal assets. And yet, so far flows into bonds have shown little sign of slowing: U.S. equity mutual funds saw $19 billion of outflows in September, while bond funds saw $32 billion of inflows, data from the Investment Company Institute show.
Long-dated U.S. Treasury investors can salivate at the prospect of the price-insensitive Fed increasing its purchases, even with yields already at rock-bottom levels. But if the central bank does succeed in juicing inflation, anybody left holding the bonds is in for a rude awakening.

Oltre ai prezzi dell'oro e ai tassi di interesse in molti tengono d'occhio i prezzi delle materie prime. Negli ultimi giorni si è assistito a un netto rialzo dei prodotti agricoli, con il future sul grano che ha guadagnato oltre il 20% in una manciata di giorni. Secondo l'Economist  i prezzi sono destinati a rimanere volatili per lungo tempo: 

China, which needs corn to fatten its vast population of pigs, is one source of support. Its assurances that home-grown supplies are adequate conflicts with evidence that it is importing large quantities of corn for the first time in 15 years. American regulators are set to raise the proportion of ethanol in fuel to 15%, which may buttress prices. The fact that prices for other crops such as soyabeans and wheat are also bubbling makes it difficult for farmers to judge which will be the most profitable crop to sow for next season, which may hamper an immediate supply response.
Price volatility could be a more permanent feature of agriculture. The concentration of farming in a few big countries means that a hungry world is dependent for its food on stable production patterns in a small number of places. Whether Russian wheat or American corn, problems in one country can send shock waves through global markets.


domenica 4 luglio 2010

Una brutta settimana o l'inizio di una brutta estate? Aggiornamento al 2 luglio 2010

Non è stata una bella settimana per i mercati:  l'indice S&P500 ha perso il 5% (il 6.6% se calcolato in euro),
l'indice Stoxx600 il 4.5% e l'Eurostoxx il 4.2%; gli indici di materie prime hanno perso quasi il 5% (e quasi l'8% se calcolati in euro anzichè in dollari). L'indice Baltic Dry ha aggiunto altri 5 giorni alla sua serie negativa raggiungendo il record di 26 giorni consecutivi di discesa (alla faccia del random walk!): si è ormai quasi dimezzato dal massimo stagionale del 27 maggio scorso.
Spicca quindi il rimbalzo dell'euro che si è rivalutato dell'1.7%, in controtendenza con la buona correlazione con i rendimenti dei mercati azionari che aveva dominato gli ultimi mesi: potete leggere  il commento del Wall Street Journal qui. Sono in molti a mettere in relazione la debolezza del  dollaro con i segni preoccupanti di rallentamento dell'economia U.S.A e soprattutto con i pessimi dati sull'occupazione di venerdì scorso. Secondo il Wall Street Journal:
Some 14.6 million people now are out of work, and some economists predict the unemployment rate could rise again in coming months as others return to the work force in search of jobs.
"It's hard to overstate how deep the hole is," Jesse Rothstein, chief economist for the Labor Department, said in an interview earlier in the week. Many people, he added, "don't seem to be appreciating the gravity of the situation."
I toni di alcuni commenti non sono troppo neri ma confermano la fase di incertezza che probabilmente proseguirà per tutta l'estate: investors may want to consider the bigger picture before assuming a double-dip. Private-sector hiring in the second quarter averaged 119,000, compared with about 78,700 in the first quarter and negative 270,000 during the final three months of 2009.
The jobs report is still not clear enough to make up investors' ever-changing minds on whether the recovery has stalled. That sets up markets for a volatile summer.
Qui trovate altre tre idee per dormire male la notte questa estate, nel caso non basti il caldo...

Ecco l'aggiornamento al 2 luglio.

La digressione paliesca venerdì scorso...ha portato fortuna alla Selva, i miei figli non potevano chiedere di più! Guardate che bella carriera: