sabato 31 marzo 2012

I mercati intermittenti....

Dal New York Times:

Stock Market Flaws Not So Rare, Data Shows

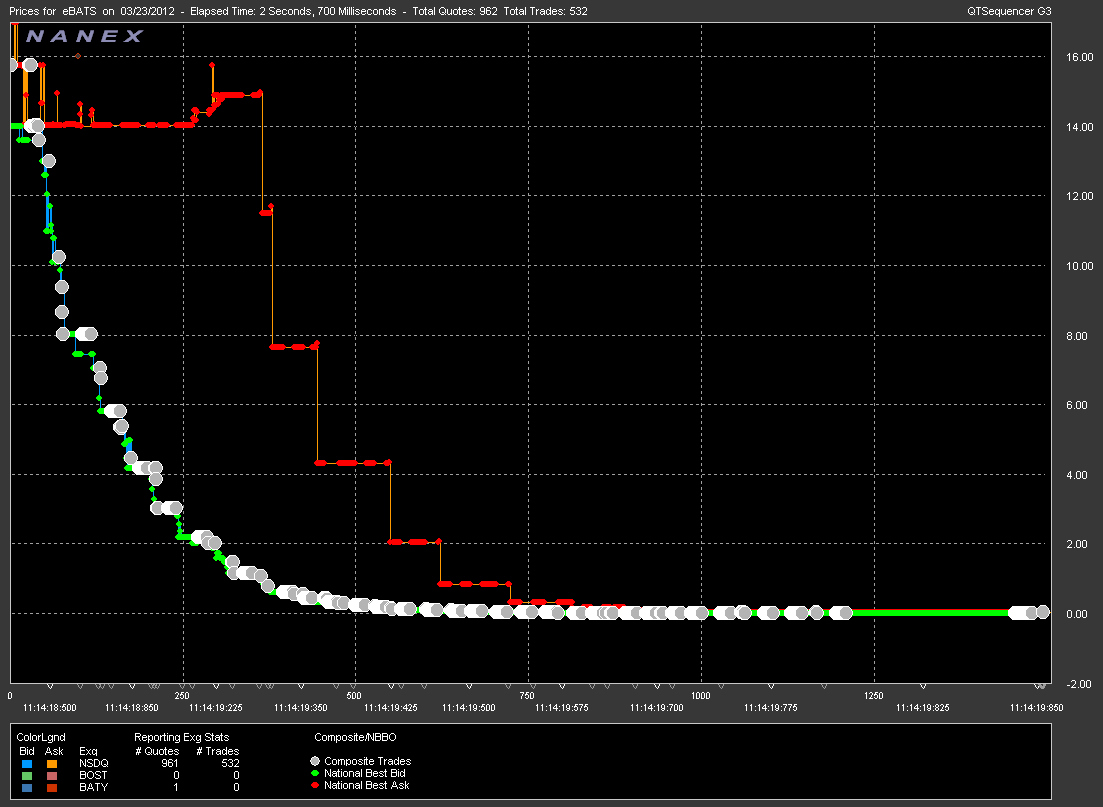
Stock market disruptions like the ones last week that temporarily shut down part of the nation’s third-largest exchange and briefly halted the trading of Apple shares are more common than investors may think.

Although traders and the public were stunned by the problems on the BATS Global Markets stock exchange on Friday, a review of industry data shows that market disruptions large and small are a daily occurrence. The frequency of the problems has rattled the confidence of some investors and companies raising money through supercharged electronic markets.

The communication breakdown that blocked trading on parts of the BATS exchange for more than an hour has been seen in at least 110 instances across the nation’s 13 stock exchanges over the last year, a review of data from Nasdaq shows. That number has gone up every year since 2007.

In one instance in January, BATS said it was unable to trade with the New York Stock Exchange for nearly 30 minutes.

Meanwhile, exchanges have halted trading in company shares after sudden spikes or falls, as happened Friday with Apple, at least 265 times over the last year — more than one for every day of trading, according to data analyzed by the Tabb Group, a market research firm. These circuit breakers kick in after stocks experience 10 percent swings in a short period of time and can be caused by a technical error or waves of electronic trading on news developments. (...)

In addition, minor events at one exchange risk spiraling out through other exchanges and setting off a severe flash crash, like the one seen in May 6, 2010, when major markets fell more than 8 percent in a matter of minutes.

Blame for the market disturbances has fallen on the growing complexity and speed of the nation’s 13 official stock exchanges — three of which are owned by the New York Stock Exchange — and dozens of less official platforms for trading. A decade ago there were only two major trading platforms, and transaction times were measured in seconds.

A regulatory change in 2007 threw open the floodgates of competition by forcing stock trades to be routed to the exchange with the best price, as long as the exchange could act immediately. The proliferation of exchanges since then has lowered the price of trading for investors, and trade times are now measured in milliseconds. In the race for speed, however, some industry experts say reliability has been sacrificed. (...)

The S.E.C. and other regulators have been examining the vulnerabilities of the market, and the impact of high-speed trading, since the flash crash in May 2010. A new committee for the Commodity Futures Trading Commission examining the issue was set to meet for the first time on Thursday.

The S.E.C. has already taken several steps to head off moments of market chaos, including the circuit-breaker measures for 10 percent swings.

The circuit breakers have also provided a new window into how often such extreme market moves happen. During periods of calm trading, like January of this year, circuit breakers were used infrequently: 14 times, according to data analyzed by Tabb. In contrast, they were used 51 times in December. The figures do not indicate how often the problems were because of the exchanges rather than other factors.

Christopher Nagy, the head of order routing at the retail broker TD Ameritrade, compared circuit breakers to brakes on a car. They are important, he said, but they become less effective as the car goes faster, as the market has in recent years.

“When you see any sort of market strife, you see chaos erupt,” he said.

The S.E.C. is considering introducing other measures to monitor the markets, like a new system, known as limit up-limit down, to halt extreme trades before they can be executed. But some market watchers say the agency has not been able to keep up with the increasing speed and complexity of the markets.

“We’ve managed over the past few years to equip the traders with Ferraris,” said Richard Bentley, the vice president for capital markets at Progress Software, which provides the industry with technology, “and the regulators are trying to keep up with them on bicycles.”

mercoledì 28 marzo 2012

Un approccio quantitativo all'asset allocation tattica di Faber

E' da qualche giorno online la nuova versione dell'articolo che  insieme a Claudio Pacati, Roberto Renò e Adrian Risso dell'Università di Siena abbiamo dedidicato all'asset allocation tattica proposta da Faber. In questo articolo cerchiamo di determinare la robustezza statistica della strategia di trend following proposta da Faber nel suo articolo A Quantitative Approach to Tactical Asset Allocation.

L'articolo di Faber è uno degli articoli più letti di financial economics degli ultmi anni: come osserviamo nell'introduzione del nostro lavoro

In Faber (2007), a very simple trend-following strategy has been proposed and “shown” to outperform the market. The simplicity of the tactical asset allocation suggested and the remarkable performance of the strategy (no losing years from 1972 to 2007) have contributed to make it an outstanding editorial success. On January 20, 2012, the paper was still the most downloaded paper on SSRN (www.ssrn.com, one of the largest online libraries of working papers) in the last 12 months and the second most downloaded paper in total (surpassed only by Solove, 2008), reaching the noteworthy figure of 84, 255 downloads. While using the number of downloads to measure the scientific relevance of a paper is certainly questionable under many respects, it is at least interesting to notice that the fourth paper in the list is Fama (1998), authored by one of the recognized fathers of the doctrine of market efficiency. 


Come i lettori di Alfa o Beta? sanno bene The trading rule proposed by Faber (2007) for asset allocation among risky  assets and a risk-free asset is as simple as that: if the monthly closing price of  the risky asset is higher than its past ten month average, buy the risky asset; else  
buy the riskless asset. This “timing” model applied to each asset of a diversified  

portfolio including United States stocks, the Morgan Stanley Capital International  
EAFE Index (MSCI EAFE), Goldman Sachs Commodity Index (GSCI), National  
Association of Real Estate Investment Trusts Index (NAREIT), and United States 


government 10-year Treasury bonds leads to rather impressive results: Better risk-
adjusted performance than a reference equally-weighted yearly rebalanced passive  

portfolio and, especially, a drastic reduction of the maximum drawdown. Published  
by the author just before the 2007–2009 financial crises its growing popularity is  
certainly due to the remarkable result of over thirty-five consecutive years of positive  
performance.

La difficoltà principale nella valutazione di strategie con una bassa frequenza di ribilanciamento come questa è la limitatezza del campione statistico a disposizione: le serie temporali a disposizione, con frequenza mensile, sono costituite da poco più di 400 dati, decisamente corte. L'approccio che abbiamo seguito è stato quello di applicare il metodo del boostrapping alle innovazioni ottenute applicando un semplice modello GARCH(1,1) applicato alle serie temporali mensili dei rendimenti dei sei asset coinvolti (oltre ai cinque asset rischiosi bisogna anche tenere conto della variabilità del tasso di renumerazione della liquidità).
Ecco il risultato che mostra nel piano media-varianza il portafoglio storico ottenuto applicando la strategia di Faber (in rosso), la frontiera efficiente calcolata ex-post dai rendimenti storici degli asset (in blu) e i risultati di cinquecento portafogli ottenuti applicando la strategia di Faber ai rendimenti simulati con il boostrapping.


E' possibile leggere i risultati delle simulazioni in modo quantitativo utilizzando una funzione di utilità per misurare la percentuale di portafogli che dominano il portafoglio di Faber (nel piano media varianza, dunque che presentano una volatilità non superiore e un rendimento non inferiore a quello di Faber). Abbiamo impiegato una funzione di utilità quadratica u(x)=x-(gx^2)/2 dove g>0 è il coefficiente di avversione per il rischio. Nella tavola qui sotto abbiamo riportato la percentuale di portafogli simulati (boostrapped) che hanno un'utilità superiore all'utilità ottenuta dalla strategia di Faber applicata alla serie storica. Questa percentuale può essere interpretata come una stima della significatività statistica (in gergo, del p-value) della strategia di Faber, fornendo una stima della probabilità che la sovraperformance sia un effetto casuale. Com'era prevedibile, al crescere dell'avversione per il rischio la strategia si comporta meglio. E' bene tuttavia osservare che un coefficiente g=4 comporta che l'investitore rifiuti un investimento con un rendimento atteso del 10% qualora la deviazione standard superi il 20%, valori assolutamente normali per un investimento di tipo azionario.

martedì 27 marzo 2012

L'I.P.O. di BATS: una discesa di nove secondi nell'abisso

Piccola rassegna stampa sul fallimento dell'I.P.O. di BATS:

Dal Wall Street Journal:
Trading Firm IPO Fizzles in Seconds
Apple Shares Also Affected as Glitch Mars Debut of BATS Global Markets
La S.E.C. ha detto di essere intenzionata a  capire cosa è successo:

The Securities and Exchange Commission said Friday it was looking at the BATS situation. "SEC staff has been and will continue to be in discussions with BATS to determine the cause and extent of the incident and steps BATS is taking to remedy the situation," an SEC spokesman said.

The day's events may rekindle questions about the reliability of the stock-market's plumbing, questions that came into sharp focus almost two years ago when the broader market plunged hundreds of points within minutes in what came to be known as the "flash crash."

"This shows the flaws in the current market structure," said Tim Quast, managing director of ModernIR LLC, a Denver company that advises public companies on market-structure issues. It demonstrates how fragile the market structure is" and highlights how vulnerable companies and investors are to computer glitches.

Trovate la cronaca del crash per esempio sul blog Deal Journal ospitato dal sito del WSJ
BATS Initial Public Tease: Nine Seconds of Free Fall

For BATS Global Markets, it took all of nine seconds for its IPO to crash.
The exchange operator stepped into the public’s view on Friday, March 23 at 11:14 and 18 seconds a.m. ET.
According to FactSet Research, the stock was trading at $15.25 with 1.2 million shares moving hands on the BATS exchange. That was down 4.7% from its pricing of $16, which had already been at the low end of its expected range of $16 to $18.
Within nanoseconds, the picture actually looked brighter.
Five trades, for a total of 800 shares, moved at $15.75 each, all of them on the Nasdaq exchange, according to the FactSet data.
Then the stock started dropping, falling to $14 then to $13 before the bottom dropped out. The stock went quickly to $10.23, to $8.03 to $5.79 to $4.17 to $3.01 all before that first second of life was over.
In that time the difference between offers to buy and offers to sell spread from being a relatively close 50-cent spread to a difference of $11.23 as holders continued to look to sell at $14.90 a share.
The second second of life was not much better: $2.17 quickly became $1.15 which fell to 76 cents before plunging all the way down to 0.0002 cents. In total, 444 trades, all of 100 shares a piece, were made in that one second, everyone on the Nasdaq.
The sellers started dropping their asking prices though nowhere near as quick as the trading prices fell. The asks fell from above $14 to $11.50 to $7.64 to $4.31 to $2.05 before capitulating and falling below a dollar.
After that fall there appeared a slight breath of comparatively rationale thought: the next trade was made at 11:14 a.m. and 21 seconds for 3 cents a share.
Shares eventually climbed back to 4 cents at 11:14 a.m. and 27 seconds, the price that first appeared on some screens this morning and the last trade made.
At 11:14 a.m. and 33 seconds the stock was first listed as halted, back at $15.25.
But all that history will now be wiped out. BATS said the opening auction will be cancelled. On FactSet the company is back to $16.
Then the IPO was officially withdrawn.
It is unclear as of this time if mulligans do exist in IPOs, but BATS is going to try.


Nanex ha dedicato un post all'analisi dell'I.P.O. di BATS, e alla simultanea "transazione erronea" su Apple:


Nanex ~ The BATS IPO and halt in AAPL
The March 23, 2012 IPO of BATS was brief. The stock began trading at  11:14:18.475 with an initial price of $15.25. Within 900 milliseconds from opening the stock price had fallen to $0.2848. Within 1.5 seconds the price bottomed at $0.0002. 567 trades were executed before the stock was halted (532 are shown below).

Another curiosity: we found that starting around 10:45 and ending around 11:20, quotes from BATS stopped updating in all NYSE and Nasdaq symbols within a specific alphabetical range: between "A  " and "BECN ". The symbol BATS falls into this range.

lunedì 26 marzo 2012

Aggiornamento al 23 marzo 2012

Dopo aver raggiunto livelli che non si vedevano dalla primavera del 2008 in molti si aspettavano una correzione dei mercati azionari U.S.A., o quanto meno una "pausa di riflessione". Così il -1,2% messo a segno questa settimana dall'indice SP500 (in euro) non è sorprendente. Ha fatto molto peggio l'indice Eurostoxx (-2,7%) che però è lontanissimo dai livelli della primavera del 2008, quando viaggiava intorno a quota 360-370 contro i 250 attuali. A dire la verità la crisi del debito europeo continua a farsi sentire ed è ancora lontano anche il massimo di 297.73 raggiunto nel 2011. 
La settimana è stata negativa anche per l'indice immobiliare globale (-2,3% in euro) e per le materie prime (-1,8%). Queste ultime sono sempre molto deboli da mesi, non un gran buon segno per le prospettive future di crescita dell'economia (e dei mercati azionari...). Hanno invece chiuso positivaente la settimana il cambio euro/dollaro e le obbligazioni trentennali dell'eurozona (entrambi con un +0,7%). 


Le strategie  top2  e top3 questa settimana hanno segnato rispettivamente un -0,2% e -1,1%. Nel 2009 le stessa strategie avevano reso rispettivamente il 12.2% e il 2.4%, nel 2010 il 22.4% e il 18.2% mentre hanno chiuso negativamente il 2011 (-13,2% e -6,6%).

La strategia che investe negli asset con  tendenza di medio periodo positiva questa settimana  ha perso l'1,4%. Positivo il 2009 +11,7%  e il 2010 con un rendimento pari al +12.1% leggermente negativo invece il 2011 con un -3,3%. Il rendimento annualizzato composto nel triennio è pari al  +6,9%, con un massimo drawdown del 9,2% e volatilità 10,3%.

La tabella qui sotto riassume il profilo rischio/rendimento delle tre strategie negli ultimi 3 anni:


Nella figura è raffigurato l'andamento di un euro investito nelle tre strategie dal 3 gennaio 2009 ad oggi.


E' bene ricordare che i rendimenti calcolati non tengono neppure conto dei costi di transazione e del prelievo fiscale. Mi preme comunque sottolineare che le analisi e le simulazioni descritte in questo blog sono da considerarsi sempre e comunque risultati teorici e relativi al passato. Chiunque decidesse di utilizzare le strategie descritte o qualsiasi altra informazione tratta da questo blog per decisioni di investimento se ne assume completamente la responsabilità.

I cambiamenti  nella classifica settimanale degli asset annullano (temporaneamente) quelli della settimana scorsa: al primo posto si insediano nuovamente le obbligazioni trentennali dell'eurozona con l'indice SP500 che torna ad occupare il secondo posto. Analogamente l'indice Eurostoxx scivola nuovamente al quarto posto mentre l'indice immobiliare globale risale al terzo posto. L'euro conserva la quinta posizione ed ora ha la tendenza di breve periodo positiva. All'ultimo posto l'indice CRB con un peggioramento segnato dal fatto che la tendenza di breve periodo è diventata negativa. Invariato il portafoglio della strategia top2 (50%  del capitale nelle obbligazioni trentennali dell'eurozona e  50% nell'indice SP500) mentre la top3 investe  il capitale dividendolo per   1/3 nell'indice SP500, 1/3 nelle obbligazioni trentennali dell'eurozona e 1/3 nell'indice immobiliare globale.  La strategia che investe negli asset che hanno una tendenza di medio periodo positiva divide invece il capitale in quattro parti uguali tra obbligazioni trentennali dell'eurozona, indice SP500, indice immobiliare globale e indice Eurostoxx, gli stessi asset della settimana scorsa.

In questo post trovate le risposte ad alcune delle domande  più frequenti relative alla metodologia che utilizzo per la costruzione della tabella e dei portafogli che aggiorno settimanalmente.
In questo post ho descritto quali ETF negoziati a Milano  replicano (in positivo o in negativo) gli indici che sono settimanalmente tracciati qui su Alfaobeta. Se volete fare delle analisi da soli, in questo post ho spiegato come procurarsi gratuitamente le serie storiche dei prezzi e dei NAV degli ETF mentre qui potete trovare qualche informazione sui costi di transazione nel mercato dei cambi.

Ecco l'aggiornamento al 23 marzo 2012.

sabato 24 marzo 2012

Aggiornamento del portafoglio Benjamin Graham

Ribilanciamo il porafoglio Benjamin Graham descritto in questo post. Il portafoglio è al suo undicesimo ribilanciamento: i precedenti sono stati nel 2011 il  25 febbraioil 31 marzo , il 29 aprile, il 30 maggio il primo luglio, il 22 agosto il primo ottobre, il 12 novembre e il 17 dicembre e nel 2012 il 4 febbraio.

Secondo lo screener del Nasdaq la composizione aggiornata con i prezzi i chiusura di venerdì 23 marzo vede 10 titoli in portafoglio:


Guru(s) StrongGuru(s) SomeSymbolCompanyPrevious CloseMkt Value $(Mil)Rel. StrengthP/EP/E/GProj P/E 12 mo.
21  ALG ALAMO GROUP, INC.  28.91 345 66 10.78 51 10.87
11  CHEUY CHEUNG KONG (HOLDINGS) LIMITED (ADR)  13.2 30848  4.96 133.88 
10  CDEVY CITY DEVELOPMENTS LIMITED (ADR)  8.81 8054  13.44 1.87 16.62
30  FRX FOREST LABORATORIES, INC.  33.96 9017 71 8.55 55.79 9.15
11  FSTR L.B. FOSTER COMPANY  28.49 292 24 12.83 12.08 10.35
22  LPH LONGWEI PETROLEUM INVESTMENT HOLD LTD  1.71 172 41 2.15 63.11 2.63
22  MLR MILLER INDUSTRIES, INC.  16.72 184 64 8.73 99.02 8.36
21  DCM NTT DOCOMO, INC. (ADR)  16.97 74575 47 13.3 -14.8 10.95
30  SEB SEABOARD CORPORATION  1942 2351 38 6.82 22.81 
20  SUHJY SUN HUNG KAI PROPERTIES LIMITED (ADR)  13.99 37222  5.79 35.26 12.38


Escono dal portafoglio di dicembre ADM, BGFV, CFK, LHCG, MKTAY, RS, SKX, YONG mentre si aggiungono ALG e MLR.

Qui sotto potete vedere in un grafico il rendimento del portafoglio (in rosso) negli ultimi sei mesi, confrontato con quello dell'indice SP500 (in azzurro). Il valore in dollari USA del portafoglio è pari a 11192 USD con un rendimento totale dalla data di creazione (31 dicembre 2010) di circa +1192 dollari pari al
+11,92%, leggermente inferiore al rendimento dell'indice di riferimento che dal 1 gennaio 2011 ad oggi ha guadagnato circa il 13,9% (sia per l'indice che per il portafoglio i rendimenti tengono conto dei dividendi). Il portafoglio ha battuto ampiamente l'indice nell'ultimo trimestre e nell'ultimo semestre.


Ecco la composizione attuale del portafoglio:


Appuntamento a tra circa un mese.