domenica 5 giugno 2011

Aggiornamento al 3 giugno 2011

Ancora una brutta settimana per gli asset che segue settimanalmente Alfa o Beta? Il deterioramento del quadro complessivo è sensibile: ora due asset su sei hanno la tendenza di medio periodo negativo (obbligazioni di lungo periodo europee e indice eurostoxx) e tre hanno la tendenza di breve periodo negativa (indice S&P500, indice di materie prime CRB e indice eurostoxx). E adesso? Secondo Alessandro Fugnoli, che scrive il settimanale di strategia Il Rosso e il Nero, un raro esempio di commento intelligente e divertente in un  panorama italiano di analisi dei mercati di straordinaria monotonia, le aspettative sono una questione di framing e in questo momento si potrebbero rivelare un po' troppo rosee. Fugnoli non crede a un terzo round di quantitative easing e vede quindi un'estate in salita per le azioni:  


Il vecchio Sell in May, giusto nel 2010, potrebbe rivelarsi altrettanto corretto nel 2011. Sarebbe in fondo positivo, perché sarebbe un segno che viviamo in tempi normali. Nel 2008 e nel 2009 il Sell in May fu completamente rovesciato. Si sarebbe dovuto vendere nell’ottobre 2008 per comprare nell’aprile 2009.
Se la crisi greca troverà una soluzione decente (come continua a parerci ben possibile) non bisognerà esagerare con la prudenza e le paure. Benché venga da otto mesi di rialzo, l’azionario non è particolarmente sovrappesato nei portafogli. Se lo fosse, a quest’ora avremmo già visto ribassi maggiori e volatilità più elevata.
Un grande scettico come El Erian, teorico del nuovo mondo grigio della new normal, è il primo a non credere a una discesa pesante degli asset di rischio. C’è troppa liquidità perché questo accada, dice.


L'indice di materie prime CRB (in euro) ha chiuso la settimana con un -1.5%, l'indice immobiliare (in euro) con un -1.8%, l'indice S&P500 (in euro) con un -4.4% e l'indice eurostoxx con un -0.9%. Decisamente
positivo invece l'andamento del cambio euro/dollaro +2.2%. In leggero progresso anche le obbligazioni governative trentennali dell'eurozona +0.1%. 
Questa settimana la strategia top2 perde l'1.1% e la top3 perde l'1.2%: il drawdown della strategia top2 dal massimo di tredici settimane fa è pari al 10.7%; il drawdown della top3 dal massimo del 7 gennaio 2011 è  pari al 5.7%.

Le strategie top2 e top3 con copertura del rischio di cambio effettuata da quando il 14 gennaio 2011 la tendenza di medio periodo dell'euro è diventata positiva avrebbero reso rispettivamente il +2.6% e +4.3%. 
Il crollo delle borse fa scivolare l'indice S&P500 dalla seconda alla quarta posizione. Il secondo posto è ora occupato dall'indice CRB mentre al terzo posto si trova l'indice immobiliare FTSE EPRA-NAREIT Global.  La  strategia top 2 suddivide quindi il capitale equipesando l'indice CRB e il cambio euro/dollaro mentre la top 3 aggiunge al paniere anche l'indice FTSE EPRA-NAREIT Global. Chi volesse utilizzare le due strategie con la copertura del rischio di cambio utilizzando una leva 3x per il cambio può costruire un portafoglio in questo modo:

top2: 37.5% FTSE EPRA-NAREIT, 37,5% CRB, 25% copertura cambio
top3: 25% S&P500, 25% CRB, 25% FTSE EPRA-NAREIT, 25% copertura cambio

L'indice eurostoxx e le obbligazioni governative europee a scadenza trentennale hanno tendenza a medio termine negativa. L'indice eurostoxx, l'indice CRB e l'indice S&P500 hanno la tendenza a breve termine negativa.

In questo post trovate le risposte ad alcune delle domande  più frequenti relative alla metodologia che utilizzo per la costruzione della tabella e dei portafogli che aggiorno settimanalmente.

In questo post ho descritto quali ETF negoziati a Milano  replicano (in positivo o in negativo) gli indici che sono settimanalmente tracciati qui su Alfaobeta. Se volete fare delle analisi da soli, in questo post ho spiegato come procurarsi gratuitamente le serie storiche dei prezzi e dei NAV degli ETF mentre qui potete trovare qualche informazione sui costi di transazione nel mercato dei cambi.

Dall'inizio del 2011 il rendimento (valutato in euro) di un portafoglio che ogni settimana investe nei primi 2 asset (top2) della tabella è pari al -8.8%, se investito nei primi tre asset (top3) il rendimento è stato del  -3.6%. Nell'intero 2009 le stessa strategie avevano reso rispettivamente il 12.2% e il 2.4% e nel 2010 il 22.4% e il 18.2%.

Nella figura è raffigurato l'andamento di un euro investito nelle due strategie dal 3 gennaio 2009 ad oggi.

Il rendimento annuale composto della strategia top2 è del 9.9%, con una volatilità del 12.2%, un massimo drawdown del 10.7% e un indice di Sharpe di poco superiore a 0.7.

Il rendimento annuale composto della strategia top 3 è pari al 6.5%, con una volatilità dell'11.9%, un massimo drawdown del 15.1% e un indice di Sharpe poco superiore a  0.4.

La strategia che investe nei primi due asset a condizione che la tendenza di medio periodo sia positiva, e in contanti nel caso contrario, ha reso nell'intero 2009 il 13.9%. Nel 2010 ha coinciso con la top2 con l'eccezione di due sole settimane (questa e questa): la performance complessiva per il 2010 è stata leggermente peggiore della top2, con un +18.6%.

La strategia che semplicemente investe in parti uguali in tutti e 6 gli asset seguiti settimanalmente da Alfaobeta
ha chiuso la settimana con una perdita dell'1% allontanandosi così dal massimo raggiunto cinque settimane fa: il il drawdown è ora pari al 2.1%.  La strategia ha reso nel 2010 il 12.6% con una volatilità del 10% mentre dall'1 gennaio 2009 ad oggi ha reso il 32.5% con un massimo drawdown del 14.8%. Il rendimento dal primo gennaio 2011 è stato dello 0.3%. Il portafoglio top2 ha reso il 25.7% dall'1 gennaio 2009 a oggi, con un massimo drawdown del 10.7%: l'ultimo massimo è stato raggiunto il 7 marzo scorso e da allora il drawdown è proprio pari al 10.7%. Il rendimento del portafoglio top2 dal primo gennaio 2011 a oggi è stato pari al -8.8%.
La strategia che settimanalmente investe il capitale dividendolo in parti uguali negli asset che hanno una tendenza di medio periodo positiva (una versione più aggressiva della strategia di Faber che invece ripartisce il capitale tra liquidità e gli asset con tendenza di medio periodo positivo) ha chiuso questa settimana con un -1.3% anch'essa allontanandosi dal massimo storico raggiuntoquattro settimane fa. Nel 2010 ha avuto un rendimento pari al 12.1% e da inizio 2009 ad oggi ha reso il 24.4%, con un massimo drawdown inferiore al 7%. La volatilità è ben inferiore al 10%.  Il rendimento dal primo gennaio 2011 a oggi è stato pari al -0.6%.

E' bene ricordare che i rendimenti calcolati non tengono neppure conto dei costi di transazione e del prelievo fiscale. Mi preme comunque sottolineare che le analisi e le simulazioni descritte in questo blog sono da considerarsi sempre e comunque risultati teorici e relativi al passato. Chiunque decidesse di utilizzare le strategie descritte o qualsiasi altra informazione tratta da questo blog per decisioni di investimento se ne assume completamente la responsabilità.

Ecco l'aggiornamento al 3 giugno 2011.

sabato 4 giugno 2011

I guai degli U.S.A. e il management che non premia gli azionisti

Macroherd
Allora incominciamo: ieri i pessimi dati sull'occupazione U.S.A....intanto il debito U.S.A. cresce, i repubblicani e i democratici non riescono a mettersi d'accordo e il rischio di un "default tecnico" aumenta. Le agenzie di rating non stanno a guardare, e così: 

Moody’s warns of US default
The ratings agency warned of a ‘small but rising risk’ the US could default on its debt, adding pressure on Congress and the White House to strike a deal on fiscal policy
http://link.ft.com/r/VKY5JJ/5COFSV/J4LRC/8A61C0/PRQIC7/E4/h?a1=2011&a2=6&a3=2


Ma il problema principale dell'economia U.S.A. in questo momento sembra essere una crescita asfittica e una dipendenza preoccupante da una Fed molto accondiscendente...


Hiring in U.S. Slowed in May With 54,000 Jobs Added

By CATHERINE RAMPELL
The unemployment rate rose to 9.1 percent, raising concerns once again about the underlying strength of the economic recovery.

War of Ideas on U.S. Budget Overshadows Job Struggle

By BINYAMIN APPELBAUM and CARL HULSE
A run of disappointing economic data is emboldening Congressional Republicans in their standoff with the White House over the best way to encourage growth.

Come osserva oggi David Reilly sul Wall Street Journal gli occhi sono nuovamente puntati sulla Fed in un mondo finanziario che sembra essere incapace di trovare soluzioni alternative alla leva finanziaria combinata con a massicce immissioni di liquidità:questa volta però le aspettative potrebbero essere deluse... 

Cue the Fed. That is one reaction to signs of economic weakness that culminated with Friday's disappointing U.S. jobs figure.
It is easy to see why. Investors, especially in stocks, have become conditioned to thinking the Federal Reserve will ride to their rescue when times get tough. But barring a precipitous drop in markets, investors shouldn't count on the Fed acting too quickly. Nor should the Fed be itching to again expand its balance sheet, after it completes its second round of bond buying in June.(...)
The overindebted U.S. faces a balance-sheet recession. Even though fiscal and monetary stimulus stopped a deflationary spiral, households and the government still need to reduce debt. Household debt as a percentage of personal income is down from bubble-era levels of about 130%, but it still needs to fall markedly.
Fed Chairman Ben Bernanke already has indicated that the bar for further extraordinary measures is higher than before. After all, though bond buying pushes up the price of riskier assets like stocks, it also carries the risk of stoking bubbles and broader inflation as well as driving up commodity prices, which sap the spending power of the poor.(...)
The likely result is a wait-and-see approach, as the Fed watches the incoming data as well as how the government responds to the debt-ceiling and deficit issues. If nothing else, Mr. Bernanke has to take off the markets' training wheels and force investors to try pedaling on their own.

Ci sono anche gli ottimisti però: dal Wall Street Journal

THE WEEKEND INTERVIEW
The Bullish Case for the U.S. Economy

Investment strategist Robert Doll says America's edge is faster population growth, companies that are global in scope, and a culture of innovation and entrepreneurship.

Sui guai dell'economia U.S.A. vi offro un piccolo pensiero un po' casuale che però non riesco a cacciare da quando ho letto questo articolo di Jason Zweig la settimana scorsa: le società U.S.A. hanno un sacco di liquidità in cassa, molta di più di quella che riescono a investire profittevolmente, che non viene redistribuita agli azionisti. Per esempio nell'ultimo trimestre
Microsoft, Cisco Systems, Google, Apple e Johnson & Johnson hanno aggiunto 15 miliardi di dollari in asset liquidi ai loro bilanci. Invece di strapagare Skype, per esempio, Microsoft avrebbe potuto forse restituire un po' dei 100 milioni di dollari al giorno che aggiunge al proprio bilancio in liquidità.

To be sure, at many companies the cash piling up is at global operations that generate "undistributed foreign earnings" that can't be brought home, under U.S. law, without incurring taxes of up to 35%. But hundreds of billions in cash remain available—and idle.
Meanwhile, the payout ratio—the proportion of earnings paid out as dividend income to shareholders—fell to 28.9% for the past four quarters. That, says S&P senior index analyst Howard Silverblatt, is the lowest level since 1936. Dividends are going up—Intel, UnitedHealth Group and WellPoint have recently raised them—but cash is still piling up far faster than most industrial giants can possibly find a prudent use for it. Of course, investors themselves might have a better use for the cash, if they could get at it.
As Daniel Peris, co-manager of the Federated Strategic Value Dividend fund, says, "The likelihood of spending money poorly is increased by having a surplus of it."
Microsoft's purchase price for the online telecommunications firm Skype, widely criticized as too rich at $8.5 billion, almost precisely matches the amount of cash that Microsoft raked in last quarter. Was that torrent of cash burning a hole in Microsoft's pocket? "No way," says Bill Koefoed, general manager of investor relations at Microsoft. "We see this as being a very strategic acquisition."

Nel suo commento Zweig riprende una proposta di Benjamin Graham che era ben consapevole della necessità di allineare gli interessi del management con quelli degli azionisti, a dispetto di una naturale tendenza alla divergenza.  

Benjamin Graham made three simple proposals in 1951 that deserve to be revived.
First, investors need to realize that a company's cash is a valuable asset, even when interest rates are low; if management won't put it to good use, investors must speak up. As Graham wrote: "When the results on capital are unsatisfactory, it is appropriate for stockholders to…insist that it be returned to stockholders on an equitable basis."
Second, companies should set formal dividend policies. Rather than paying or raising dividends out of the blue, they should state in advance what proportion of earnings they expect to pay out as cash dividends. If, instead, they plan to use excess cash to buy back shares, they should offer hard evidence that the stock is undervalued.
Finally, Graham advocated that leading companies should pay out two-thirds of their earnings as dividends. That rate isn't as radical as it might sound, even though it would amount to more than a doubling from today's levels. The dividend payout, as a percentage of total profits, has averaged 52.3% since 1936 and 46% over the past two decades, according to Standard & Poor's.
If the companies in the S&P 500 raised their payout ratio to 50%, Mr. Silverblatt estimates, that would put an extra $207 billion into investors' pockets—at a time when shareholders' dividend income is taxed at historically low rates.
"Companies are basically earning more than they've ever made before, but their payouts are nowhere near that high," says Mr. Silverblatt. "They're holding their cash really tight. You can call them Scrooges if you want."


Forse un modo per rilanciare un po' l'economia sarebbe anche quello di redistribuire un po' i profitti. Dopo tanta socializzazione delle perdite ci potrebbe anche stare. O no? 
 

giovedì 2 giugno 2011

La disoccupazione, il 1937, la BCE e l'insolvenza "tecnica": letture per il ponte

Una compilazione di articoli da sfogliare in questo ponte di inizio estate: iniziamo con il New York Times, che si preoccupa per la rielezione di Obama messa in pericolo dalla disoccupazione troppo alta


Economic Memo

Employment Data May Be the Key to the President's Job

By BINYAMIN APPELBAUM
No president since Franklin Roosevelt has won re-election with unemployment above 7.2 percent. To keep his own job, it appears President Obama may have to defy this trend.
Il tema è caro a Paul Krugman che ieri sul suo blog sottolineava ancora una volta il rischio che si ripetano gli errori che nel 1937 fecero ripiombare gli USA in depressione. Secondo Krugman il rischio che ciò si verifichi è molto alto in Europa, se se la prende con Bini Smaghi: The research staff at the NY Fed won’t; but the ECB very probably will, and the Board of Governors is under a lot of political pressure to raise rates.
We’ve learned a lot less these past 74 years than you might have imagined — or rather, we learned some stuff, but have spent the last few decades unlearning it.
Update: And here’s Lorenzo Bini Smaghi of the ECB insisting that yes, we do intend to repeat the mistake of 1937.

Se è possibile trovo ancora più allarmante questo post sul blog di Krugman dedicato all'ultimo commento di Martin Wolf sul Financial Times di qualche giorno fa:  slow-motion bank runs are already in progress in the European periphery, and that these countries’ banking systems are being sustained only by a process in which, say, Ireland’s central bank borrows from the Bundesbank and then lends the funds on to Irish private banks to replace the fleeing deposits. Here are claims among central banks as of the end of last year:
 
Financial Times: Claims among European central banks

You can see why we’re now at the panic stage. The Bundesbank is already very upset about its large claims on troubled debtors, which are backed by sovereign debt as collateral. Yet if financing stops in the wake of a debt restructuring, the result will be to collapse the debtor nations’ banking systems, a process Martin believes would lead to their ejection from the euro. (He makes me look like an optimist!)
So the ECB keeps saying that restructuring is unthinkable. Yet austerity programs are not working; the prospect of a return to normal financing is receding rather than approaching.
If you ask me, the water level has now dropped so far that the fuel rods are exposed. We really are in meltdown territory.

Ieri i mercati hanno subito la pressione sia dell'ulteriore downgrade della Grecia che dei pessimi dati macro provenienti dagli U.S.A.: ecco due titoli dal Financial Times di oggi


Fears for recovery bolster US Treasuries
Yield on 10-year notes falls to 2.94%, a new low for the year, as fresh data suggest the US economy is mired in a soft patch
http://link.ft.com/r/J0VG55/D4M197/WFZ6Y/V1R5VY/WL3Q52/T3/h?a1=2011&a2=6&a3=1
Greece goes further into junk territory
The European Central Bank has backed the idea of encouraging banks to roll-over Greek bonds as a way of helping the country out of its financial plight
http://link.ft.com/r/J0VG55/D4M197/WFZ6Y/V1R5VY/C5A8NZ/T3/h?a1=2011&a2=6&a3=1


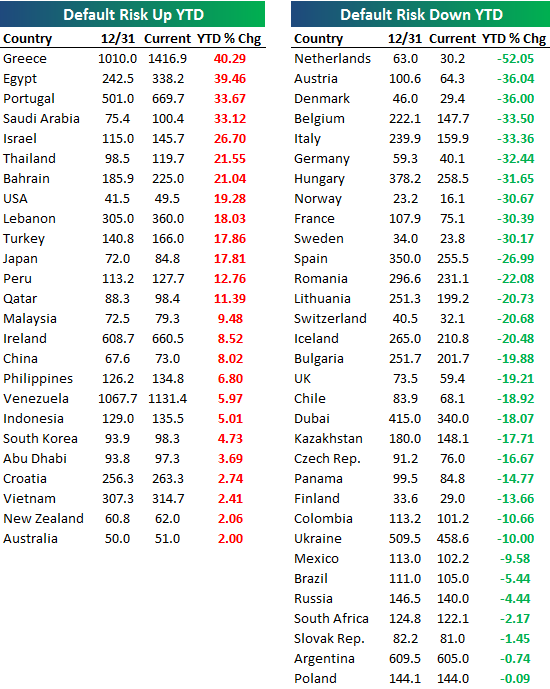
C'è da osservare come il calo dei tassi dei Treasury bonds si accompagna ormai da settimane a un rialzo dei CDS che per il debito USA con scadenza a cinque anni sono ormai vicini a 50 punti base: dall'inizio dell'anno
ad oggi l'aumento (in termini relativi) del prezzo dei CDS mette gli U.S.A. davvero in cattiva compagnia, come mostra la  tabella qui accanto tratta da seekingalpha. 
C'è davvero chi compra obbligazioni del governo U.S.A. e simultaneamente si protegge da rischio default con i CDS? Magari sperando nell'insolvenza "tecnica" se repubblicani e democratici non riesocno a mettersi d'accordo entro il 2 agosto?

martedì 31 maggio 2011

Nostalgia del passato o saggezza utile per il futuro?

Dal New York Times un racconto di un banchiere di altri tempi: Robert G. Wilmers.

For nearly 30 years, Wilmers has run the M&T Bank, based in Buffalo. When he took it over, M&T had $2 billion in assets; today, its assets exceed $68 billion, and it's one of the most highly regarded regional bank holding companies. It has also been one of the best performing stocks in the Standard & Poor's 500-stock index; indeed, M&T was one of only two banks in the S.& P. 500 that didn't cut its dividend during the financial crisis. Wilmers's report, however, was less about the company's numbers than about the dismal state of his beloved profession. Wilmers, it turns out, is that rarest of birds: a banker willing to tell harsh truths about banking. That, for instance, much of the money the big banks earn comes from trading profits "rather than the prudent extension of credit that furthers commerce." That derivatives had helped bring about the crisis and needed to be regulated. That bank executives were wildly overpaid. That the biggest banks -the Too Big to Fail Banks -were operating, as he put it, an "unsafe business model."
Secondo Wilmers un'industria un tempo relativamente semplice e con uma naturale avversione per il rischio
"It has become a virtual casino," he replied. "To me, banks exist for people to keep their liquid income, and also to finance trade and commerce." Yet the six largest holding companies, which made a combined $75 billion last year, had $56 billion in trading revenues. "If you assume, as I do, that trading revenues go straight to the bottom line, that means that trading, not lending, is how they make most of their money," he said. This was a problem for several reasons. First, it meant that banks were taking excessive risks that were never really envisioned when the government began insuring deposits -and became, in effect, the backstop for the banking industry. Second, bank C.E.O.'s were being compensated in no small part on their trading profits -which gave them every incentive to keep taking those excessive risks. Indeed, in 2007, the chief executives of the Too Big to Fail Banks made, on average, $26 million, according to Wilmers -more than double the compensation of the top nonbank Fortune 500 executives. (Wilmers made around $2 million last year.) Finally -and this is what particularly galled him -trading derivatives and other securities really had nothing to do with the underlying purpose of banking. He told me that he thought the Glass-Steagall Act -the Depression-era law that separated commercial and investment banks -should never have been abolished and that derivates need to be brought under government control. "It doesn't need to be studied for two years," he said. "I would put derivative trading in a subsidiary and tax it at a higher rate. If they fail, they fail."

Le opinioni del Sig. Wilmers sono nette e forse un po' semplicistiche, ma se siete curiosi potete trovare l'articolo
qui: il titolo scelto dal NYT è: The Good Banker
Sull'argomento del rischio sistemico, le banche e i derivati potete anche dare un'occhiata a questo post:
I derivati e il rischio sistemico
Published with Blogger-droid v1.6.9

Ancora polemiche sull'IPO di Linkedin

Dal Financial Times di oggi:

Wall Street ‘mispriced’ LinkedIn’s IPO
A prominent Facebook investor and director accused Wall Street of undervaluing the LinkedIn initial public offering,contributing to the doubling of its shares on opening day


http://link.ft.com/r/NA70KK/26GWVD/I51J0/5CBJ5D/9ZCRVZ/YT/h? a1=2011&a2=5&a3=31
Published with Blogger-droid v1.6.9

lunedì 30 maggio 2011

Aggiornamento del portafoglio Benjamin Graham

Con un giorno di anticipo ribilanciamo il porafoglio Benjamin Graham descritto in questo post e già ribilanciato il 25 febbraio,   il 31 marzo e il 29 aprile 2011.

Secondo lo screener del Nasdaq la composizione aggiornata con i prezzi i chiusura di venerdì 27 maggio (la borsa di New York è stata chiusa lunedì 30) vede l'uscita dal portafoglio di LPH, il ritorno di AMN,  CSR e
BNGPY (Benetton) e l'ingresso di LHCG e CTRN per un numero complessivo di titoli che sale da 6 a 10.


Value Investor Either Interest Level
Based on our analysis of the book by Benjamin Graham
Click on any header to sort by that variable.
Symbol Company All
Interest
Strong
/Some
This
Guru's
Quant
Score
Previous
Close
Mkt Value
$(Mil)
Rel.
Strength
P/E P/E/G Proj
P/E
12
mo.
 SKX   SKECHERS USA, INC.  2 / 2    100% 17.70   881   10   9   0.5   13
 SNY   SANOFI-AVENTIS SA (ADR)  3 / 0    100% 38.41   100,023   69   14   1.1   6
 LHCG   LHC GROUP, INC.  2 / 1    100% 27.13   507   26   11   0.4   12
 ELP   COMPANHIA PARANAENSE DE ENERGIA (ADR)  2 / 0    100% 26.80   6,842   78   14   0.7   8
 CTRN   CITI TRENDS, INC.  1 / 1    100% 16.66   250   10   12   2.0   12
 CW   CURTISS-WRIGHT CORP.  1 / 1    100% 33.55   1,557   41   14   3.5   13
 BNGPY   BENETTON GROUP SPA (ADR)  1 / 0    100% 14.97   1,383     9    
 AMN   AMERON INTERNATIONAL CORPORATION  1 / 0    100% 64.36   588   36   14     40
 SUHJY   SUN HUNG KAI PROPERTIES LIMITED (ADR)  1 / 0    100% 15.07   38,827     9   1.1   16
 CSR   CHINA SECURITY & SURVEILLANCE TECH. INC.  1 / 0    100% 5.09   457   51   6   0.7   5
 GD   GENERAL DYNAMICS CORPORATION  2 / 4    86% 70.20   26,114   40   10   0.8   10
 BG   BUNGE LIMITED  1 / 4    86% 72.76   10,711   81   5   0.1  
 GME   GAMESTOP CORP.  2 / 2    86% 27.75   3,920   63   10   0.4   9
 LIWA   LIHUA INTERNATIONAL, INC.  1 / 3    86% 7.60   228   28   5   0.1   4
 YHGG   YASHENG GROUP  0 / 4    86% 1.64   254     3   0.2  
 RINO   RINO INTERNATIONAL CORPORATION  2 / 1    86% 0.65   16     0   0.0  
 CBEH   CHINA INTEGRATED ENERGY, INC.  2 / 1    86% 1.84   73   4   1   0.0   1
 FUQI   FUQI INTERNATIONAL, INC.  1 / 2    86% 3.00   80   4   1   0.0  
 LPH   LONGWEI PETROLEUM INVESTMENT HOLD LTD  1 / 2    86% 1.61   162   19   2   0.1   3
 SORL   SORL AUTO PARTS, INC.  1 / 2    86% 5.28   102   13   5   0.2   5
Pricing information provided by Media General
Price as of yesterday's close price.

Qui sottoo potete vedere in un grafico il rendimento del portafoglio dal 31 dicembre 2010 a oggi, confrontato con quello dell'indice S&P500 (in azzurro). Il valore in dollari USA del portafoglio  è pari a  10,399 USD con un rendimento totale dalla data di creazione (31 dicembre 2010) di 399 USD pari al +4.0%.

Ecco le transazioni di oggi:
Sell LPH 967@1.56
Sell ELP 26@26.84
Sell SNY 19@38.68
Sell CW 24@33.82
Sell SKX 26@17.65
Sell SUHJY 46.69@15.24
Buy LHCG 38@26.8
Buy CTRN 62@16.69
Buy AMN 15@65.5
Buy BNGPY 68@15.3
Buy CSR 206@4.97

Appuntamento al 30 giugno.
Published with Blogger-droid v1.6.9