E' divertente prendendo l'aereo riempirsi di quotidiani...il rischio è di mettersi a leggerli e di perdere troppo tempo. E' quanto mi è capitato ieri tornando a casa da Parigi. Sul Financial Times mi ha però molto colpito la storia di Svend Egil Larsen e Peder Veiby, due day traders indipendenti norvegesi condannati dal Tribunale di Oslo per manipolazione dei mercati. Secondo il FT i due hanno scoperto indipendentemente l'uno dall'altro un pattern prevedibile in un algoritmo di trading computerizzato utilizzato da un market maker statunitense di alcuni titoli norvegesi poco liquidi, e hanno impiegato questa conoscenza a proprio vantaggio, guadagnando circa 40000 sterline in circa cinque mesi. Secondo il FT
Mr Veiby found that the bid and ask prices moved up and down in tandem after each trade, making it easy to predict the spread between them.
He also noticed that the algorithm would respond in the same way to a small trade as it did to a larger one. This allowed him to buy a large number of shares at a low price and then make several smaller trades to bid up the price before selling out at a profit.
Svend Egil Larsen, the other defendant and a full-time day-trader for the past seven years, made the same discovery separately.
La scoperta di Veiby e Larsen è certamente un tributo alle loro buone qualità di analisi:
Niels Buhl, senior partner at Arctic Lake, which builds algorithms, said he had no knowledge of the Norwegian case but that it would be possible for someone to work out what an algo was doing by looking at market data, prices and any trading patterns that the algo had produced and working back from there.
“You can measure statistically what is happening in the market and do some forecasting,” he said, but added: “It’s not always easy to guess what an algo is doing otherwise a lot of people would be doing it.”
Ecco come vede il caso il FT, io sono completamente d'accordo con il commento del quotidiano inglese:
The outcome may be legally sound but does little to serve public interest. For there is no social gain from protecting the principals behind an algorithm of such breathtaking stupidity. No one forced them to trade this way: indeed the aim of automated trading is to find and exploit patterns more efficiently than the outmoded humans who on this occasion bested it. (...) The court also said the trades drove up volatility. This is true - but surely programmers of a robot that ratchets up prices indiscriminately whenever someone buys from it share the blame. Regulatory investigation of the sort US authorities carried out into the May "flash crash" would be useful - as would letting the market root out stupid algorithms in its own way: by bankrupting their owners.
Ero sicuro di trovare un adeguato commento e analisi su Econotwist
ma con sorpresa ho scoperto che il blog è stato sospeso da Wordpress! Qualcuno sa come mai? Spulciando però il blog attraverso le copie cache disponibili grazie a Google (ancora per poco però) ho trovato ampi stralci della testimonianza di Espen Haug al processo, in qualità di esperto. Sono riprodotti anche su The Swapper e potete leggerli qui. Per saperne di più sull'algoritmo che i due trader hanno ingannato vi consiglio questo post, sempre su The Swapper. Ecco in sintesi come hanno fatto (Timber Hill è il nome del broker che utilizzava l'algoritmo):
[Trader] One trader (Timber Hill) is in the book with a 5k bid at 9.7 and a 5k ask at 10.
[Trader] You buy 5000 “XYZ” at 10 from Timber Hill (TMB).
[Trader] Then TMB moves the bid to a 9,8 and the ask to 10,10.
[Trader] You buy 100 at 10,10.
[Trader] TMB moves to 9,9/bid and 10,2/ask.
[Trader] You buy 100 at 10,20.
[Trader] TMB moves to 10/bid and 10,30/ask.
[Trader] You buy 100 at 10,30.
[Trader] TMB moves to 10,1/bid and 10,4/ask.
[Trader] You buy 100 at 10,40.
[Trader] TMB moves to 10,2/bid and 10,5/ask.
[Trader] You buy 100 at 10,5.
[Trader] TMB moves to 10,3/bid and 10,6/ask.
[Trader] Then you sell 5500 at 10,3 (even if it shows only 5000, it’s hidden and takes the rest too).
[Trader] If you can short the stock, you dump 5k at 10,30/bid, and follow the same pattern on the way down.
[Trader] P/L
[Trader] 56650-55150=1500
“You can do this over and over again because Timber Hill doesn’t have a learning curve,” the trader points out.
Visualizzazione post con etichetta trading. Mostra tutti i post
Visualizzazione post con etichetta trading. Mostra tutti i post
sabato 16 ottobre 2010

sabato 25 settembre 2010
Nuovi airbags per il trading ad alta frequenza?
Il trading algoritmico computerizzato e' responsabile di buona parte degli scambi che avvengono sui mercati regolamentati: ad esempio la settimana
scorsa il trading algoritmico ha prodotto circa il 42% dei volumi negoziati ogni giorno a New York (corrispondente a piu' di un miliardo di azioni scambiate giornalmente e complessivamente oltre cinque miliardi di azioni scambiate alla settimana).
NYSE PROGRAM TRADING
Volume in millions of shares for the week ending
Sept. 17, 2010
In attesa di conoscere il rapporto finale della commissione istituita dalla S.E.C., al trading computerizzato ad alta frequenza e alla polverizzazione dei mercati elettronici in numerose piattaforme non armonizzate e' stata da alcuni attribuita la causa del flash crash del 6 maggio scorso. Secondo il Wall Street Journal
Stock-exchange operators and regulators are moving closer toward replacing new circuit breakers for individual stocks with curbs that would limit trading outside of a set range, according to people familiar with the matter.
The U.S. Securities and Exchange Commission has stepped up talks with exchange operators and market participants over establishing in equities markets the "limit-up/limit-down" system already in place for futures trading in the equity market.
The circuit-breaker system briefly halts trading in a specific stock if its price drops or rises by a certain percentage in five minutes. The limit-up/limit-down model would prevent investors from trading beyond the parameters that currently trigger the circuit breakers, but would allow traders to continue buying and selling stocks within those parameters and not freeze trading in that stock altogether.
The changeover could happen in the fourth quarter, after the current circuit-breaker pilot program expires in December, the people familiar with the matter said. Regulators and exchanges are continuing to shape new rules in response to the "flash crash" of May 6, a swift plunge in U.S. stock benchmarks that saw some stocks briefly trade at one cent per share before the market staged a quick recovery. Thousands of trades were canceled and a new system of circuit breakers was soon implemented to curb rapid price swings.
Industry consensus has built around the concept since it was first floated by exchanges and trading firms in June, though many of the key details have yet to be worked out. Regulators have said they are interested in exploring the idea further.
"One method we are examining closely involves establishing limit-up/limit-down style trading parameters under which trades would have to be executed within a range tied to the national best bid and offer," SEC Chairman Mary Schapiro said at the Security Traders Association conference in Washington on Wednesday.
"This approach would prevent aberrant trades from occurring outside specified parameters, while still allowing trading to continue within the established limits," she said.
scorsa il trading algoritmico ha prodotto circa il 42% dei volumi negoziati ogni giorno a New York (corrispondente a piu' di un miliardo di azioni scambiate giornalmente e complessivamente oltre cinque miliardi di azioni scambiate alla settimana).
NYSE PROGRAM TRADING
Volume in millions of shares for the week ending
Sept. 17, 2010
| INDEX | OTHER | ||
|---|---|---|---|
| TOP 20 FIRMS | ARBITRAGE | STRATEGIES | TOTAL* |
| Morgan Stanley | 20.1 | 590.9 | 1,154.0 |
| Goldman Sachs | 0.7 | 536.2 | 751.7 |
| Credit Suisse | 3.8 | 386.3 | 394.7 |
| Deutsche Bank | 34.9 | 298.0 | 332.9 |
| Barclays Capital | ..... | 322.9 | 388.1 |
| SG Americas | 40.5 | 196.4 | 236.9 |
| Merrill Lynch | ..... | 229.3 | 275.8 |
| Wedbush Securities | ..... | 190.1 | 190.1 |
| RBC Capital | 57.3 | 88.5 | 145.8 |
| J.P. Morgan | ..... | 133.5 | 133.5 |
| BNP Paribas | ..... | 109.1 | 109.1 |
| Citigroup Global | ..... | 105.3 | 243.3 |
| UBS Securities | ..... | 98.6 | 98.6 |
| SIG Brokerage | 61.2 | 31.7 | 92.9 |
| Schon-EX | ..... | 80.4 | 80.4 |
| RBS Securities | ..... | 67.8 | 67.8 |
| ABN Amro | ..... | 48.5 | 48.5 |
| Interactive Brokers | 0.1 | 41.3 | 41.4 |
| Millenco | 0.3 | 39.7 | 40.0 |
| Nomura Securities | ..... | 37.8 | 37.8 |
| OVERALL TOTAL | 238.9 | 3,796.7 | 5,047.8 |
| *Total includes crossing session 2 | |||
| Source: New York Stock Exchange | |||
In attesa di conoscere il rapporto finale della commissione istituita dalla S.E.C., al trading computerizzato ad alta frequenza e alla polverizzazione dei mercati elettronici in numerose piattaforme non armonizzate e' stata da alcuni attribuita la causa del flash crash del 6 maggio scorso. Secondo il Wall Street Journal
Stock-exchange operators and regulators are moving closer toward replacing new circuit breakers for individual stocks with curbs that would limit trading outside of a set range, according to people familiar with the matter.
The U.S. Securities and Exchange Commission has stepped up talks with exchange operators and market participants over establishing in equities markets the "limit-up/limit-down" system already in place for futures trading in the equity market.
The circuit-breaker system briefly halts trading in a specific stock if its price drops or rises by a certain percentage in five minutes. The limit-up/limit-down model would prevent investors from trading beyond the parameters that currently trigger the circuit breakers, but would allow traders to continue buying and selling stocks within those parameters and not freeze trading in that stock altogether.
The changeover could happen in the fourth quarter, after the current circuit-breaker pilot program expires in December, the people familiar with the matter said. Regulators and exchanges are continuing to shape new rules in response to the "flash crash" of May 6, a swift plunge in U.S. stock benchmarks that saw some stocks briefly trade at one cent per share before the market staged a quick recovery. Thousands of trades were canceled and a new system of circuit breakers was soon implemented to curb rapid price swings.
Industry consensus has built around the concept since it was first floated by exchanges and trading firms in June, though many of the key details have yet to be worked out. Regulators have said they are interested in exploring the idea further.
"One method we are examining closely involves establishing limit-up/limit-down style trading parameters under which trades would have to be executed within a range tied to the national best bid and offer," SEC Chairman Mary Schapiro said at the Security Traders Association conference in Washington on Wednesday.
"This approach would prevent aberrant trades from occurring outside specified parameters, while still allowing trading to continue within the established limits," she said.
sabato 18 settembre 2010
I buoni vecchi tempi!
Perdonate questo post un po' frivolo, ma non ho resistito leggendo l'articolo e vedendo la foto che lo accompagna, che indica anche un certo gusto per la provocazione... Ecco a voi, dal Wall Street Journal del 10 settembre,
un articolo sulla dolce vita di tre esperti di trading algoritmico
![[BRIARGATE-jump]](https://lh3.googleusercontent.com/blogger_img_proxy/AEn0k_tda6tDKMwHlryOEbU5XbGmpVp5dX4US7BQmAPhOhItAX8Yx0O_QhYWd050jUVo5wgI1dgPwGh6tecaQoiSa1b5xDOb4oHhbZ-BkXuuvOcBg1ocqZlAjwtd_4LCs2452lPmogN-9q8KPDI9Bz7PUalHxA=s0-d) Michael Rubenstein for The Wall Street Journal
Michael Rubenstein for The Wall Street Journal
NEW YORK—On the day the "flash crash" bludgeoned the stock market and chaos swept over the floor of the New York Stock Exchange, the founders of Briargate Trading were at the movies.
Rick Oscher and Steven Rubinstein weren't playing hooky. Briargate, a proprietary-trading firm that the two former NYSE floor "specialist" traders started in 2008, is mostly active at the stock market's open and close.
In between, when market activity typically drops, the Wall Street veterans play tennis in Central Park, take leisurely lunches, visit their children's schools and work out at the gym.(...)
Briargate—an anagram of "arbitrage"—isn't the only firm taking an extended recess during the 6½-hour U.S. trading day. Trading has become increasingly concentrated in the first and last hours of the session.
Those two hours now make up more than half of the entire day's trading volume, according to an analysis of data provided by Thomson Reuters. In August, the first and last hour generated nearly 58% of New York Stock Exchange primary volume, up from 45% in August 2005, the analysis shows. The rise of high-frequency trading, where algorithms are used to exploit small discrepancies in high-volume situations, amplifies the concentration of trading at the beginning and end of the day, analysts say.
Il piccolo fondo propietario ha solo altri due dipendenti, oltre ai tre traders che vedete rilassarsi nella foto.
Briargate trades mostly stocks, using computer algorithms that still require human decision-making. Sometimes the firm's programmer is left in charge when the rest of the staff leaves the office.
Mr. Oscher said the firm, which trades only its own money, hedges its risks "so there isn't any scenario that would move our profit and loss beyond boundaries of comfort."(...)
Mr. Oscher says their compensation is "in line" with what they formerly made as specialists. Successful specialists could make upward of $500,000 at the industry's peak, while partners could bring home more than $1 million.
Both feel their freedom is fragile, as trading invariably carries risks. Says Mr. Oscher: "We say all the time—these are the good old days."
un articolo sulla dolce vita di tre esperti di trading algoritmico
The Traders Who Skip Most of the Day
At Briargate, Stock Market's Open and Close Is All That Matters. Then, Golf.
Michael Rubenstein for The Wall Street Journal For Briargate's Rick Oscher, Steven Rubinstein and James DeMaira, 'midday action' means soaking up the sun.
Rick Oscher and Steven Rubinstein weren't playing hooky. Briargate, a proprietary-trading firm that the two former NYSE floor "specialist" traders started in 2008, is mostly active at the stock market's open and close.
In between, when market activity typically drops, the Wall Street veterans play tennis in Central Park, take leisurely lunches, visit their children's schools and work out at the gym.(...)
Briargate—an anagram of "arbitrage"—isn't the only firm taking an extended recess during the 6½-hour U.S. trading day. Trading has become increasingly concentrated in the first and last hours of the session.
Those two hours now make up more than half of the entire day's trading volume, according to an analysis of data provided by Thomson Reuters. In August, the first and last hour generated nearly 58% of New York Stock Exchange primary volume, up from 45% in August 2005, the analysis shows. The rise of high-frequency trading, where algorithms are used to exploit small discrepancies in high-volume situations, amplifies the concentration of trading at the beginning and end of the day, analysts say.
Il piccolo fondo propietario ha solo altri due dipendenti, oltre ai tre traders che vedete rilassarsi nella foto.
Briargate trades mostly stocks, using computer algorithms that still require human decision-making. Sometimes the firm's programmer is left in charge when the rest of the staff leaves the office.
Mr. Oscher said the firm, which trades only its own money, hedges its risks "so there isn't any scenario that would move our profit and loss beyond boundaries of comfort."(...)
Mr. Oscher says their compensation is "in line" with what they formerly made as specialists. Successful specialists could make upward of $500,000 at the industry's peak, while partners could bring home more than $1 million.
Both feel their freedom is fragile, as trading invariably carries risks. Says Mr. Oscher: "We say all the time—these are the good old days."
lunedì 13 settembre 2010
Quando tutto è correlato il rischio di crash aumenta?
Si levano da più parti grida di allarme: la correlazione tra le azioni che compongono l'indice S&P500 e l'indice stesso è ai massimi storici, confrontabili solo a quelli che precedettero...il lunedì nero dell'ottobre 1987.
 Ne parlò il Wall Street Journal del 12 luglio scorso, e di nuovo il 31 luglio osservando che the options market puts implied correlation at more than 80%, meaning that eight out of 10 stocks in the Standard & Poor's 500-stock index will move in the same direction as the index.
Typically, when stock-market volatility falls, as it has in the past few months, so does the overall market's implied correlation. Not this time.
The Chicago Board Options Exchange Volatility Index, or VIX, has fallen by almost half during the past three months. Yet the market's implied correlation has barely budged, falling from a high of 78% in May to 73% now, still well above its level of 56% in April, according to CBOE data.
In fact, the implied correlation for the S&P 500 is higher now than it was even during the peak of the financial crisis in early 2009.
Some of today's higher correlations could be permanent, a result of the huge shift in recent years toward ETFs and away from individual stocks.
Still, some pros are betting that correlations will fall.
"I'm surprised correlation has stayed this high," says Rajesh Malhotra, head of index trading, Americas, at Nomura Securities International. "At some point it should move back toward 50%."
One way the pros try to take advantage of high implied correlation is by using an arbitrage strategy called a dispersion trade: They buy options on an individual stock and sell options on an ETF. The bet is that the two will become less correlated over time.
A slightly easier way for ordinary investors to play the dispersion theme is by using a variation of a "covered call" strategy. Normally a covered call involves buying a stock and then selling a call option on that stock, giving the buyer the right to buy the stock if it hits a certain price.
By selling the call they get to collect a premium upfront, which helps protect against losses on the stock they bought. A covered call is a way to get some upside while protecting some on the downside.
To bet on dispersion, you can tweak the covered-call strategy slightly: You buy an individual stock and simultaneously sell a call on an ETF. Why? Because during periods of high implied correlation the premium on the ETF is typically higher than it would be for the individual stock, making the trade potentially more profitable.
L'indice CBOE di correlazione implicita al quale si fa riferimento è ancora vicino ai massimi di luglio-agosto: potete seguirne l'andamento qui oppure qui, e scaricare la serie giornaliera dal gennaio del 2007 qui. Se volete capire meglio come viene costruito potete leggere questo articolo che descrive la metodologia con la quale l'indice è stato costruito e viene calcolato.
Vi segnalo infine da Seeking Alpha questo post di TraderMark che discute gli stessi temi, attribuendo una buona parte della convergenza degli indici e tra azioni e indici al trading algoritmico e alla crescita del mercato degli ETF.

Typically, when stock-market volatility falls, as it has in the past few months, so does the overall market's implied correlation. Not this time.
The Chicago Board Options Exchange Volatility Index, or VIX, has fallen by almost half during the past three months. Yet the market's implied correlation has barely budged, falling from a high of 78% in May to 73% now, still well above its level of 56% in April, according to CBOE data.
In fact, the implied correlation for the S&P 500 is higher now than it was even during the peak of the financial crisis in early 2009.
Some of today's higher correlations could be permanent, a result of the huge shift in recent years toward ETFs and away from individual stocks.
Still, some pros are betting that correlations will fall.
"I'm surprised correlation has stayed this high," says Rajesh Malhotra, head of index trading, Americas, at Nomura Securities International. "At some point it should move back toward 50%."
One way the pros try to take advantage of high implied correlation is by using an arbitrage strategy called a dispersion trade: They buy options on an individual stock and sell options on an ETF. The bet is that the two will become less correlated over time.
A slightly easier way for ordinary investors to play the dispersion theme is by using a variation of a "covered call" strategy. Normally a covered call involves buying a stock and then selling a call option on that stock, giving the buyer the right to buy the stock if it hits a certain price.
By selling the call they get to collect a premium upfront, which helps protect against losses on the stock they bought. A covered call is a way to get some upside while protecting some on the downside.
To bet on dispersion, you can tweak the covered-call strategy slightly: You buy an individual stock and simultaneously sell a call on an ETF. Why? Because during periods of high implied correlation the premium on the ETF is typically higher than it would be for the individual stock, making the trade potentially more profitable.
L'indice CBOE di correlazione implicita al quale si fa riferimento è ancora vicino ai massimi di luglio-agosto: potete seguirne l'andamento qui oppure qui, e scaricare la serie giornaliera dal gennaio del 2007 qui. Se volete capire meglio come viene costruito potete leggere questo articolo che descrive la metodologia con la quale l'indice è stato costruito e viene calcolato.
Vi segnalo infine da Seeking Alpha questo post di TraderMark che discute gli stessi temi, attribuendo una buona parte della convergenza degli indici e tra azioni e indici al trading algoritmico e alla crescita del mercato degli ETF.
venerdì 4 giugno 2010
Abolire le agenzie di rating, l'arbitraggio della latenza, Basilea n+1 e i CDS sulle banche europee
L'articolo di Andrew Ross Sorkin sul New York Times di qualche giorno fa sulle agenzie di rating mi era sfuggito: si tratta di uno j'accuse senza mezze parole che potete leggere qui.
Ci sono tanti modi di implementare strategie di trading ad alta frequenza, molti dei quali comportano un giusto premio alla creatività e intelligenza dei loro ideatori: non c'è dubbio però che questo tipo di vantaggi (bellino l'eufemismo....latency arbitrage) dovrebbero essere eliminati!
Dal G20 ci si aspetta un sostanziale passo avanti verso Basilea 3. Però aspettare il 2022 per la sua piena implementazione mi sembra un po' tanto. Leggendo l'articolo si trova una frase agghiacciante come:
As part of the rule-making process, the banks conducted studies this spring to gauge the likely impact of the proposals on their capital and liquidity levels.
The data show that banks world-wide would face huge capital and liquidity shortfalls under the proposals, according to government and industry officials briefed on the results.
In Europe, bank executives say there is likely to be a gap of more than €1 trillion ($1.2 trillion) between banks' current capital and liquidity buffers and what would be required under the Basel proposals.
In comparison, stress tests ordered by the U.S. government last year resulted in 10 of the nation's biggest banks being told to raise a combined $74.6 billion in capital to cushion themselves.
E poi vi stupite che l'euro sia in caduta libera e che la crisi (pardon..."correzione") delle borse abbia avuto inizio proprio in Europa?
 Intanto la liquidità si sta nuovamente prosciugando anche se siamo ancora lontani dai livelli parossistici del dopo Lehman. La paura degli investitori in un nuovo aggravarsi della crisi finanziaria, magari con qualche banca europea che finisce gambe all'aria, è in continuo aumento, almeno a giudicare dal costo dei CDS sulle principali banche europee, come mostra il grafico qui accanto tratto da un articolo dell'Economist sull'argomento.
Ci sono tanti modi di implementare strategie di trading ad alta frequenza, molti dei quali comportano un giusto premio alla creatività e intelligenza dei loro ideatori: non c'è dubbio però che questo tipo di vantaggi (bellino l'eufemismo....latency arbitrage) dovrebbero essere eliminati!
Dal G20 ci si aspetta un sostanziale passo avanti verso Basilea 3. Però aspettare il 2022 per la sua piena implementazione mi sembra un po' tanto. Leggendo l'articolo si trova una frase agghiacciante come:
As part of the rule-making process, the banks conducted studies this spring to gauge the likely impact of the proposals on their capital and liquidity levels.
The data show that banks world-wide would face huge capital and liquidity shortfalls under the proposals, according to government and industry officials briefed on the results.
In Europe, bank executives say there is likely to be a gap of more than €1 trillion ($1.2 trillion) between banks' current capital and liquidity buffers and what would be required under the Basel proposals.
In comparison, stress tests ordered by the U.S. government last year resulted in 10 of the nation's biggest banks being told to raise a combined $74.6 billion in capital to cushion themselves.
E poi vi stupite che l'euro sia in caduta libera e che la crisi (pardon..."correzione") delle borse abbia avuto inizio proprio in Europa?

giovedì 13 maggio 2010
Come cambierà l'eurozona? Le cause del minicrollo del 6 maggio e la definanzializzazione dell'economia secondo Taleb
L'Economist appena uscito dedica un approfondimento al futuro dell'Europa dopo il superbailout: giustamente si osserva come le cause della crisi sono ancora tutte lì e si sia soltanto guadagnato tempo
(ma ce n'era bisogno, eccome!)
EUROPE’S €750 billion ($950 billion) plan to defend its single currency may have been received with euphoria, but it was born of despair. When euro-zone leaders gathered over the weekend of May 8th-9th they faced the sickening reality that the fear in southern Europe’s government-bond markets was spreading to its banking system and beginning to infect global credit markets. This plan was not just about preventing Greece’s sovereign-debt crisis spreading to Portugal and Spain. It was about stemming a growing financial panic that could have plunged the world economy back into the quagmire from which it has spent the past two years struggling to escape.
So European leaders were right to act (...)
In the short term this massive show of financial firepower has worked. Bond markets have calmed; the odds of a cascading series of defaults have diminished. The temptation is to declare victory and move on. Yet the job is not even half-complete. This plan buys time, but it does not repair the fiscal and structural flaws that led the euro zone into this mess in the first place. Worse, it comes with risks attached that Europe urgently needs to deal with. (...)
Hardest of all will be finding the political will to curb profligacy. This struggle will become woven into the conflict that now tugs at the political fabric of Europe. (...)
The one thing that seems clear is that all this will lead to greater interference in countries’ politics (see article). But what sort exactly? (...) The scene is set for an ugly political battle over how to run Europe
Sempre dall'Economist vi segnalo un approfondimento sulle banche nei paesi emergenti e un articolo sul crash del 6 maggio scorso. Quest'ultimo è un tema che mi sta particolarmente a cuore, come avrete ormai capito. Scrive l'Economist:
BEFORE May 6th equities had been seen as that rare thing, a financial market that had continued to function unimpaired through the crisis. It took just 20 minutes to shatter that image.(...)
The search is still on for a specific trigger for what has become known as the “flash crash”.(...)
In the meantime Ms Schapiro is turning her attention to the fragmented structure and lightning speed of stockmarkets. Over the past few years trading has increasingly moved to new exchanges that allow transactions to happen more rapidly and more cheaply. In 2003 the New York Stock Exchange (NYSE) handled about 80% of trading volume of its listed stocks, but by the end of 2009, that share had fallen to 25% (see chart). A good chunk has gone to upstart electronic-trading platforms, such as Direct Edge and BATS, which execute trades in milliseconds.
Regulations have not kept up.(...)
Another factor was the sudden retreat by the “high frequency” firms whose algorithmic trading has come to dominate equity markets. In normal times they play a crucial role in providing liquidity. But unlike marketmakers, they are not obliged to do so during bouts of turbulence. Regulators think that some high-frequency traders switched off their programs when prices began to spiral, fearful that their trades would be cancelled because of the severity of the declines. Manoj Narang, the boss of Tradeworx, a hedge fund with a high-frequency trading business, says he shut off when he “noticed the prices were erroneous”, because he knew exchanges would cancel those trades (as they did).
How will regulators prevent another sudden lurch downward? The SEC has suggested a more rigorous, co-ordinated market-wide system of “circuit breakers”, which would require all exchanges to stop or slow trading for a few minutes if the market experiences a certain rate of decline. A stock-specific “circuit breaker”, which would do the same for particular shares, may also be enacted.
Reform will not end there. The struggle to make sense of the billions of trades executed on May 6th gives momentum to a proposal the SEC released in April to require large traders (those trading at least 20m shares or $200m a month) to register with it. This would make it easier for the agency to track high-frequency trading in the future. “Market orders”, which ask for a stock to be sold at the best available price without specifying a minimum—as opposed to “limit orders”, which set a floor—are also coming under fire. It only lasted minutes, but the flash crash will have consequences that last for years.
Secondo CNBC news le nuove regole imposte dalla SEC saranno annunciate già lunedì prossimo ma
occorreranno 1-2 mesi per implementarle.
Il congresso USA cerca di capire come sia stato possibile il minicrollo di giovedì 6 maggio:
Nel crash di giovedì a cavarsela particolarmente male sono stati gli ETF: a quanto pare è colpa degli arbitraggisti che immettono ordini al meglio
Investors have learned to lean on exchange-traded funds for their dependable liquidity. For a few minutes last week, that support fell through.
Some 68% of the wild trades canceled after Thursday's market plunge were transactions involving ETFs, estimates Credit Suisse's Portfolio Strategy Group. That's far larger than the roughly 25% of daily trading volume ETFs typically represent.
Why did ETFs shock so many investors? One reason is that trading by arbitragers has kept some ETFs even more liquid than typical S&P 500 stocks. When an ETF contains a basket of U.S.-listed stocks, for instance, traders can profit by trading the fund until it converges with its underlying value. As a result of this deep liquidity, investors over time became confident enough to trade ETFs without putting price limits on their orders.(...)
The problem is that some investors had placed orders specifying quantity but not price. They got stuck with the best prices available—suddenly well below the price a short time earlier. That likely explains why iShares Russell 1000 Value fell from $60 a share to a few cents. Such trades were deemed erroneous and reversed, but many less-extreme transactions will stand.
Infine ecco l'opinione dell'esperto mondiale di cigni neri sulla questione, ricostruita attraverso i suoi scritti da un redattore del Wall Street Journal:
Philosopher and hedge fund adviser Nassim Taleb admitted recently to being bored with Wall Street.
“I am bored with finance and interested in worthier missions,’’ like climate change and medicine, the “Black Swan” author confesses on his website.
We wonder, though, if last Thursday’s flash crash might have piqued his interest again.(...)
Taleb says on his website that he’s not giving interviews ahead of the upcoming release of the updated, paperback version of “The Black Swan. So Deal Journal has been scouring Taleb’s voluminous writings, tweets, and media interviews looking for whether he gave any clues about the rationale behind his fund’s options purchase. Of course, there are none.
The causes of the flash crash may prove out one of Taleb’s more general theories about random events: “People underestimate the amount of luck and overestimate the amount of skills,’’ that determine the fate of market events, he said on the Econ Talk blog.
By Taleb’s logic, then, many of the proposals that are being bandied about today when the heads of the New York Stock Exchange and Nasdaq testify before Congress are not likely to help prevent another “flash crash.”
That is because measures such as circuit breakers and limits on high frequency trading give what Taleb calls the “illusion of control” over a complex, inter-connected market where black swans are inevitable.
We are not totally helpless, though, Taleb says. While we can’t prevent a black swan event, we can take steps to minimize its impact. Writing in April 2009 in the Financial Times, Taleb outlined 10 principles a “Black Swan proof world.” Many of his ideas have to do with reducing leverage, complexity and moral hazard in the financial system, but he also thinks that one of the biggest problems is that the stock market itself has taken on an over-sized role in the lives of ordinary people.
(ma ce n'era bisogno, eccome!)
EUROPE’S €750 billion ($950 billion) plan to defend its single currency may have been received with euphoria, but it was born of despair. When euro-zone leaders gathered over the weekend of May 8th-9th they faced the sickening reality that the fear in southern Europe’s government-bond markets was spreading to its banking system and beginning to infect global credit markets. This plan was not just about preventing Greece’s sovereign-debt crisis spreading to Portugal and Spain. It was about stemming a growing financial panic that could have plunged the world economy back into the quagmire from which it has spent the past two years struggling to escape.
So European leaders were right to act (...)
In the short term this massive show of financial firepower has worked. Bond markets have calmed; the odds of a cascading series of defaults have diminished. The temptation is to declare victory and move on. Yet the job is not even half-complete. This plan buys time, but it does not repair the fiscal and structural flaws that led the euro zone into this mess in the first place. Worse, it comes with risks attached that Europe urgently needs to deal with. (...)
Hardest of all will be finding the political will to curb profligacy. This struggle will become woven into the conflict that now tugs at the political fabric of Europe. (...)
The one thing that seems clear is that all this will lead to greater interference in countries’ politics (see article). But what sort exactly? (...) The scene is set for an ugly political battle over how to run Europe
Sempre dall'Economist vi segnalo un approfondimento sulle banche nei paesi emergenti e un articolo sul crash del 6 maggio scorso. Quest'ultimo è un tema che mi sta particolarmente a cuore, come avrete ormai capito. Scrive l'Economist:
BEFORE May 6th equities had been seen as that rare thing, a financial market that had continued to function unimpaired through the crisis. It took just 20 minutes to shatter that image.(...)
The search is still on for a specific trigger for what has become known as the “flash crash”.(...)
In the meantime Ms Schapiro is turning her attention to the fragmented structure and lightning speed of stockmarkets. Over the past few years trading has increasingly moved to new exchanges that allow transactions to happen more rapidly and more cheaply. In 2003 the New York Stock Exchange (NYSE) handled about 80% of trading volume of its listed stocks, but by the end of 2009, that share had fallen to 25% (see chart). A good chunk has gone to upstart electronic-trading platforms, such as Direct Edge and BATS, which execute trades in milliseconds.
Regulations have not kept up.(...)
Another factor was the sudden retreat by the “high frequency” firms whose algorithmic trading has come to dominate equity markets. In normal times they play a crucial role in providing liquidity. But unlike marketmakers, they are not obliged to do so during bouts of turbulence. Regulators think that some high-frequency traders switched off their programs when prices began to spiral, fearful that their trades would be cancelled because of the severity of the declines. Manoj Narang, the boss of Tradeworx, a hedge fund with a high-frequency trading business, says he shut off when he “noticed the prices were erroneous”, because he knew exchanges would cancel those trades (as they did).
How will regulators prevent another sudden lurch downward? The SEC has suggested a more rigorous, co-ordinated market-wide system of “circuit breakers”, which would require all exchanges to stop or slow trading for a few minutes if the market experiences a certain rate of decline. A stock-specific “circuit breaker”, which would do the same for particular shares, may also be enacted.
Reform will not end there. The struggle to make sense of the billions of trades executed on May 6th gives momentum to a proposal the SEC released in April to require large traders (those trading at least 20m shares or $200m a month) to register with it. This would make it easier for the agency to track high-frequency trading in the future. “Market orders”, which ask for a stock to be sold at the best available price without specifying a minimum—as opposed to “limit orders”, which set a floor—are also coming under fire. It only lasted minutes, but the flash crash will have consequences that last for years.
Secondo CNBC news le nuove regole imposte dalla SEC saranno annunciate già lunedì prossimo ma
occorreranno 1-2 mesi per implementarle.
Il congresso USA cerca di capire come sia stato possibile il minicrollo di giovedì 6 maggio:
Nel crash di giovedì a cavarsela particolarmente male sono stati gli ETF: a quanto pare è colpa degli arbitraggisti che immettono ordini al meglio
Investors have learned to lean on exchange-traded funds for their dependable liquidity. For a few minutes last week, that support fell through.
Some 68% of the wild trades canceled after Thursday's market plunge were transactions involving ETFs, estimates Credit Suisse's Portfolio Strategy Group. That's far larger than the roughly 25% of daily trading volume ETFs typically represent.
Why did ETFs shock so many investors? One reason is that trading by arbitragers has kept some ETFs even more liquid than typical S&P 500 stocks. When an ETF contains a basket of U.S.-listed stocks, for instance, traders can profit by trading the fund until it converges with its underlying value. As a result of this deep liquidity, investors over time became confident enough to trade ETFs without putting price limits on their orders.(...)
The problem is that some investors had placed orders specifying quantity but not price. They got stuck with the best prices available—suddenly well below the price a short time earlier. That likely explains why iShares Russell 1000 Value fell from $60 a share to a few cents. Such trades were deemed erroneous and reversed, but many less-extreme transactions will stand.
Infine ecco l'opinione dell'esperto mondiale di cigni neri sulla questione, ricostruita attraverso i suoi scritti da un redattore del Wall Street Journal:
Philosopher and hedge fund adviser Nassim Taleb admitted recently to being bored with Wall Street.
“I am bored with finance and interested in worthier missions,’’ like climate change and medicine, the “Black Swan” author confesses on his website.
We wonder, though, if last Thursday’s flash crash might have piqued his interest again.(...)
Taleb says on his website that he’s not giving interviews ahead of the upcoming release of the updated, paperback version of “The Black Swan. So Deal Journal has been scouring Taleb’s voluminous writings, tweets, and media interviews looking for whether he gave any clues about the rationale behind his fund’s options purchase. Of course, there are none.
The causes of the flash crash may prove out one of Taleb’s more general theories about random events: “People underestimate the amount of luck and overestimate the amount of skills,’’ that determine the fate of market events, he said on the Econ Talk blog.
By Taleb’s logic, then, many of the proposals that are being bandied about today when the heads of the New York Stock Exchange and Nasdaq testify before Congress are not likely to help prevent another “flash crash.”
That is because measures such as circuit breakers and limits on high frequency trading give what Taleb calls the “illusion of control” over a complex, inter-connected market where black swans are inevitable.
We are not totally helpless, though, Taleb says. While we can’t prevent a black swan event, we can take steps to minimize its impact. Writing in April 2009 in the Financial Times, Taleb outlined 10 principles a “Black Swan proof world.” Many of his ideas have to do with reducing leverage, complexity and moral hazard in the financial system, but he also thinks that one of the biggest problems is that the stock market itself has taken on an over-sized role in the lives of ordinary people.
“Economic life should be definancialised. We should learn not to use the market as storehouses of value: They do not harbour the certainties that normal citizens require. Citizens should experience anxiety about their own businesses (which they control) not their investments (which they do not control),” he writes.
domenica 28 marzo 2010
Day trading? La ricchezza delle regioni italiane. Prevedere i rendimenti futuri dell'indice S&P500
Questo post di TraderMark su SeekingAlpha mi ha fatto sorridere e ve lo segnalo.
Volete dedicarvi al day trading? A me non pare una buona idea, comunque troverete forse interessante questo articolo del New York Times
Oggi e domani ci sono le elezioni regionali: trovate qui e qui e tabelle comparative
Volete dedicarvi al day trading? A me non pare una buona idea, comunque troverete forse interessante questo articolo del New York Times
Oggi e domani ci sono le elezioni regionali: trovate qui e qui e tabelle comparative
dei principali indicatori economici delle regioni in cui è in corso la votazione, raccolte da www.lavoce.info. Secondo gli autori (Fonte: Istat, Eurostat - elaborazione dati Davide Baldi e Ludovico Poggi) raffrontando le regioni tra loro e rispetto alle medie nazionali, i lettori possono farsi un'idea dello sviluppo economico e civile raggiunto nei diversi territori, nonché della qualità dei loro governi.
 Infine vi segnalo un interessante post di Prieur du Plessis su Seekingalpha:
 il tentativo è di prevedere i rendimenti azionari su una scala di tempo lunga (10 anni) utilizzando la metodologia di Robert Shiller che impiega come predittore il rapporto prezzo/utili dell'indice S&P500 mediato sugli ultimi 10 anni di profitti reali (deflazionati) aggregati dell'indice. L'evidenza a supporto di questa relazione è robusta come mostra la prima delle figure qui accanto. Invece del rapporto prezzo su utili si possono utilizzare i dividendi (anch'essi deflazionati e mediati su dieci anni) giungendo a conclusioni molto simili.
Le conclusioni non sono troppo incorraggianti:
I dati necessari per riprodurre le analisi riportate sopra sono messi a disposizione da Robert Shiller sulla sua pagina web. Conoscete qualche link dove poter trovare gli stessi dati (magari solo per 30-40 anni anziche per 140 anni) per altri indici azionari? Per esempio per azioni inglesi o giapponesi?
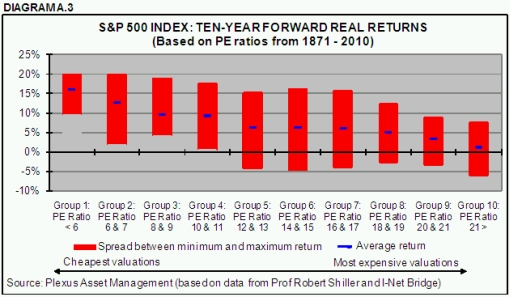
 il tentativo è di prevedere i rendimenti azionari su una scala di tempo lunga (10 anni) utilizzando la metodologia di Robert Shiller che impiega come predittore il rapporto prezzo/utili dell'indice S&P500 mediato sugli ultimi 10 anni di profitti reali (deflazionati) aggregati dell'indice. L'evidenza a supporto di questa relazione è robusta come mostra la prima delle figure qui accanto. Invece del rapporto prezzo su utili si possono utilizzare i dividendi (anch'essi deflazionati e mediati su dieci anni) giungendo a conclusioni molto simili.
Le conclusioni non sono troppo incorraggianti:
Based on the above research findings, with the S&P 500 Index’s current ten-year normalized PE of 20.3 and ten-year normalized dividend yield of 2.1%, investors should be aware of the fact that the market is by historical standards expensive. As far as the market in general is concerned, this argues for unexciting long-term returns, possibly a “muddle-through” trading range for quite a number of years to come.
Although the research results offer no guidance as to calling market tops and bottoms, they do indicate that it would not be consistent with the findings to bank on above-average returns based on the current ten-year normalized valuation levels. As a matter of fact, there is a distinct possibility of some negative returns off current price levels.
I dati necessari per riprodurre le analisi riportate sopra sono messi a disposizione da Robert Shiller sulla sua pagina web. Conoscete qualche link dove poter trovare gli stessi dati (magari solo per 30-40 anni anziche per 140 anni) per altri indici azionari? Per esempio per azioni inglesi o giapponesi?
Iscriviti a:
Post (Atom)


 Post
Post


