Visualizzazione post con etichetta Hindenburg Omen. Mostra tutti i post

lunedì 6 settembre 2010

Mamma non avere paura dell'Hindenburg Omen!

Mentre in Europa il mercato azionario è ancora percepito come una cosa da ricchi, o da scommettitori incalliti e divorati dal diavolo del gioco, negli Stati Uniti le cose stanno ben diversamente, poichè per la maggior parte delle famiglie americane è dai propri investimenti che ci si aspetta di costruire un capitale sufficiente per soddisfare le esigenze della famiglia,  come la pensione e
i costi esorbitanti dell'educazione dei figli (secondo l'Economist College fees have for decades risen faster than Americans’ ability to pay them. Median household income has grown by a factor of 6.5 in the past 40 years, but the cost of attending a state college has increased by a factor of 15 for in-state students and 24 for out-of-state students. The cost of attending a private college has increased by a factor of more than 13 (a year in the Ivy League will set you back $38,000, excluding bed and board). Academic inflation makes medical inflation look modest by comparison).

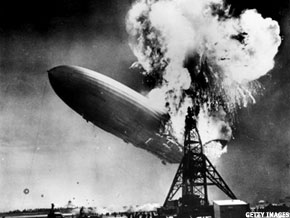
Così a nessun commentatore finanziario europeo verrebbe in mente di iniziare un articolo come ha fatto Charles Rotblut, vicepresidente dell'AAII, l'associazione americana degli investitori individuali: A bubble may be forming in bearish indicators. A sign of just how much attention pessimistic prognosticators are getting occurred last week when my mother asked me about the Hindenburg Omen. This is an arcane indicator that uses technical analysis criteria to try to predict a forthcoming market crash.

Like many forecasting tools, the accuracy of the Hindenburg Omen is questionable. Market timing is far more difficult than it seems. A combination of luck and historical trends can translate into one or two correct market calls and make a market timing system seem better than it actually is. This could be the case over the next few weeks if September lives up to its reputation. 


Il creatore dell'Omen è Jim Miekka, un signore cinquantenne del Maine, editore di una newsletter finanziaria, il Sudbury Bull & Bear Repor. Secondo il Wall Street Journal il sig. Miekka sostiene che the trio of Hindenburg Omen appearances this month (in agosto) doesn't bode well, especially since a cluster of occurrences tends to lead to more significant declines. He said it is possible the market could drop 20% from the first sighting two weeks ago.
"It's like a funnel cloud," Mr. Miekka says. "You don't get a storm with every funnel cloud, but now that we're seeing several funnel clouds, I definitely think I want to stay in the storm cellar."
Mr. Miekka's foray into stocks began after he was injured while conducting experiments at a Massachusetts mine, where he was trying to find a better way to extract minerals from rock. There was an explosion from chemicals he was working with, and was blinded by complications during an ensuing eye operation. "The last thing I saw was the eye chart going into surgery," he said.
As he recuperated, Mr. Miekka said he began listening to television shows that focused on investing, and began actively putting his money into the market.
He came up with his first trading "system" in 1989. Now, he is working on a number of other indicators, such as a short-term five-day buy signal based on the trading patterns of two market averages over the past 25 days.
Mr. Miekka, who publishes the "Sudbury Bull & Bear Report," said his newest indicator has been "very effective." But he is keeping the indicator's name and the names of the averages to himself.

giovedì 19 agosto 2010

Ancora sulle obbligazioni e sull'Hindenburg Omen

Piccola rassegna di post sull'argomento obbligazioni e sull'Hindeburg Omen:
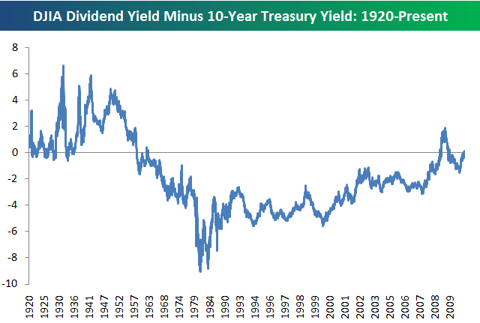
  • iniziamo con due post di Bespoke: nel primo si contesta (senza un riferimento esplicito) l'affermazione che the Dow's dividend yield is now greater than the 10-Year Treasury yield (...and...) that this is the first time this has happened in decades, but in actuality, the Dow's yield got much higher than the 10-Year yield as recently as late 2008 and early 2009. La differenza oggi aumenta ancora con il calo del Dow e dello yield dei bond decennali dopo la pubblicazione dei dati economici U.S.A. così deludenti. Nel secondo, dedicato all'Hindenburg Omen, si fa osservare come
    A closer look at the list of new highs, however, shows that the "stocks" hitting new highs last Thursday were hardly stocks at all. The WSJ provides a list of NYSE listed stocks hitting new highs and new lows on a daily basis, and looking at last Thursday's list of new highs shows that practically all of them were closed-end fixed income securities, preferred stocks, or some other form of fixed income product masquerading as an equity. In fact, of the 92 issues that hit new highs on Thursday (8/12), less than ten were common stocks.
    Se si limita l'analisi del segnale alle azioni, escludendo quindi le obbligazioni scambiate sul NYSE e travestite da azioni, per esempio limitandosi ad analizzare le azioni che costituiscono l'indice S&P500  si scopre che il 12 agosto scorso only 0.2% of the stocks in the S&P 500 hit new highs while 5.6% of the stocks in the index hit new lows. A day when 5.6% of the stocks in the S&P 500 hit new lows is hardly a sign of strength, but it also doesn't reflect the indecision and confusion that the Hindenburg Omen is supposed to convey. Call us crazy, but an indicator that measures the internals of the equity market should probably avoid using fixed income securities in its analysis. On a side note, the Hindenburg Omen was last triggered in June 2008, and back then the indicator would have been triggered using either the NYSE or the S&P 500.
    Insomma: non solo il fondamento statistico dell'Omen è perlomeno discutibile ma anche la sua definizione ha forse bisogno di qualche  piccolo aggiustamento. 
  • Brad De Long contesta l'analisi dei monetaristi osservando come la velocità del denaro abbia oscillazioni sempre più ampie rispetto alla trendline e in questo post interviene nel dibattito sulla bolla nel mercato delle obbligazioni del Tesoro U.S.A., rispondendo all'articolo di Siegel e Schwartz sul WSJ e raccontato ieri da Alfaobeta. Secondo De Long in questo caso parlare di una bolla è fuorviante poichè A bubble--I thought--is when those holding an asset do so because they expect its price to rise more-or-less indefinitely, and such a price rise is impossible. Such a bubble is very prone to rapid collapse when people realize that their expectations are very wrong. Do holders of U.S. Treasury bonds expect the prices of the assets they own to rise more-or-less indefinitely? No, they do not. They expect their holdings of Treasury bonds to be and to continue to be safe places to park their money, and they expect other asset classes to be risky.
    Over time, I think, the fear of other asset collapses will ebb--but this is highly likely to produce a gradual rise in the prices of other asset classes and a gradual fall in Treasury prices, but a gradual fall does not make Treasury bonds unsafe.
    Those who hold Treasuries to maturity will get the returns they expect: for holders-to-maturity, Treasury bonds are indeed very safe absent a very unlikely upward leap in inflation.
    So I cannot see any possibility of a bubble collapse at the short end of the Treasury market--less than ten years, seven.
    Secondo De Long anche chi investe in obbligazioni con durata lunga, fino ai trenta anni, corre rischi molto limitati, specialmente se si tiene conto della situazione macroeconomica. La differenza di posizione con Siegel-Schwartz non è sorprendente perchè riflette anche visioni divergenti delle prospettive dell'economia U.S.A. come avevo osservato ieri nel commento al loro articolo. Ecco come conclude il suo post Brad De Long:  Could there be a sudden large downward movement in Treasury bond prices that would convince holders of Treasuries that they are not safe at all and induce a wave of panicked selling that would look like the collapse of a bubble?
    In asset prices, never say never: the only thing you can ever say with absolute certainty is J.P. Morgan's: "they will fluctuate."
    But I don't think so. People today buy an on-the-run ten-year Treasury at a yield of 2.64%--the bond with a 2.65% coupon maturing on August 15, 2020 at a price of 100.07. Its price drops tomorrow to 88.96. Do they conclude that their long Treasury position is too risky to hold? Or do they conclude that the Treasury correction has come and gone, and that Treasuries are actually safer than ever?
    To argue that there is a Treasury bond bubble going on, you have to believe that such a fall in Treasury bond prices would induce further selling. And I cannot see that--not with the current state of macroeconomic news.

mercoledì 18 agosto 2010

L'Hindenburg omen viziato dalla bolla nelle obbligazioni?

Dal sito del Wall Street Journal, la parte divertente viene verso il secondo minuto:


martedì 17 agosto 2010

Un nuovo crash in autunno?

I sostenitori dell'analisi tecnica sono molto sensibili agli indicatori di breadth: un mercato sano deve avere un buon bilancio tra tori e orsi in modo da sostenere i trend in atto, specialmente al rialzo. Un indicatore temutissimo è l'Hindenburg Omen poichè espressamente concepito per anticipare possibili crash del mercato azionario U.S.A. Secondo il Wall Street Journal la definizione dell'indicatore prevede:

The Omen's Criteria

All criteria must be met for a confirmed occurrence.
  • The daily number of new NYSE 52-week highs and the daily number of new 52-week lows must both be greater than 2.5% of the total issues traded that day.
  • The smaller of the 52-week highs and lows must be greater than or equal to 79 (or 2.5% of 3,168 issues).
  • The NYSE's 10-week moving average must be rising.
  • The McClellan Oscillator, a measure of market fluctuations, must be negative.
  • New 52-week highs can't be more than twice the new 52-week lows. (However, it is acceptable for the new 52-week lows to be more than double the 52-week highs.)
L'Omen ha svolto un buon lavoro nell'anticipare i crash degli ultmi 20 anni:

The Omen was behind every market crash since 1987, but also has occurred many other times without an ensu. ing significant downturn. Market analysts said only about 25% of Omen appearances have led to stock-market declines that can be considered crashes.
"The Hindenburg Omen does show some deteriorating internals, which signals some major concerns," said Ryan Detrick, senior technical strategist at Schaeffer's Investment Research. "But it isn't a reason to move to 100% in cash. We're taking a wait-and-see approach, but considering its recent history, we're considering it more than other indicators."

Se volete saperne di più potete dare un'occhiata anche qui. 
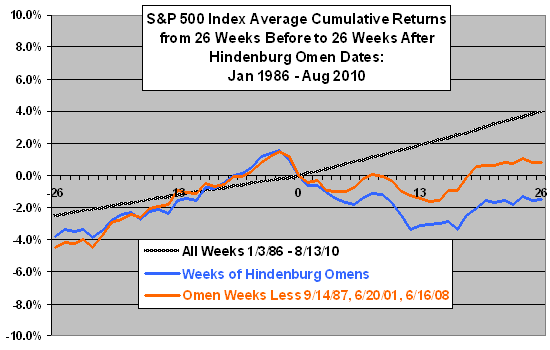
Bisogna però stare molto attenti a tirare delle conclusioni sugli indicatori di crash: il campione statistico che si ha a disposizione è limitatissimo (è curioso che nessuno abbia provato a verificarne l'affidabilità su altri mercati, come ad esempio quello inglese, tedesco o giapponese...se qualche lettore è in grado di indicarmi qualche referenza bibliografica o qualche post sul web a questo riguardo gli sarei molto grato). Una discussione dell'affidabiltà di questo indicatore che solleva la questione del rischio di data mining e overfitting of rules to historical data è svolta nel blog di CXOadvisory. In particolare l'efficacia dell'Omen sembra essere dovuta al successo nell'anticipare i crolli del 1987, del 2001 e del 2008, come indica la figura qui accanto. Tenete presente che dal 1986 ad oggi si contano 27 segnali in tutto.