martedì 31 maggio 2011

Nostalgia del passato o saggezza utile per il futuro?

Dal New York Times un racconto di un banchiere di altri tempi: Robert G. Wilmers.

For nearly 30 years, Wilmers has run the M&T Bank, based in Buffalo. When he took it over, M&T had $2 billion in assets; today, its assets exceed $68 billion, and it's one of the most highly regarded regional bank holding companies. It has also been one of the best performing stocks in the Standard & Poor's 500-stock index; indeed, M&T was one of only two banks in the S.& P. 500 that didn't cut its dividend during the financial crisis. Wilmers's report, however, was less about the company's numbers than about the dismal state of his beloved profession. Wilmers, it turns out, is that rarest of birds: a banker willing to tell harsh truths about banking. That, for instance, much of the money the big banks earn comes from trading profits "rather than the prudent extension of credit that furthers commerce." That derivatives had helped bring about the crisis and needed to be regulated. That bank executives were wildly overpaid. That the biggest banks -the Too Big to Fail Banks -were operating, as he put it, an "unsafe business model."
Secondo Wilmers un'industria un tempo relativamente semplice e con uma naturale avversione per il rischio
"It has become a virtual casino," he replied. "To me, banks exist for people to keep their liquid income, and also to finance trade and commerce." Yet the six largest holding companies, which made a combined $75 billion last year, had $56 billion in trading revenues. "If you assume, as I do, that trading revenues go straight to the bottom line, that means that trading, not lending, is how they make most of their money," he said. This was a problem for several reasons. First, it meant that banks were taking excessive risks that were never really envisioned when the government began insuring deposits -and became, in effect, the backstop for the banking industry. Second, bank C.E.O.'s were being compensated in no small part on their trading profits -which gave them every incentive to keep taking those excessive risks. Indeed, in 2007, the chief executives of the Too Big to Fail Banks made, on average, $26 million, according to Wilmers -more than double the compensation of the top nonbank Fortune 500 executives. (Wilmers made around $2 million last year.) Finally -and this is what particularly galled him -trading derivatives and other securities really had nothing to do with the underlying purpose of banking. He told me that he thought the Glass-Steagall Act -the Depression-era law that separated commercial and investment banks -should never have been abolished and that derivates need to be brought under government control. "It doesn't need to be studied for two years," he said. "I would put derivative trading in a subsidiary and tax it at a higher rate. If they fail, they fail."

Le opinioni del Sig. Wilmers sono nette e forse un po' semplicistiche, ma se siete curiosi potete trovare l'articolo
qui: il titolo scelto dal NYT è: The Good Banker
Sull'argomento del rischio sistemico, le banche e i derivati potete anche dare un'occhiata a questo post:
I derivati e il rischio sistemico
Published with Blogger-droid v1.6.9

Ancora polemiche sull'IPO di Linkedin

Dal Financial Times di oggi:

Wall Street ‘mispriced’ LinkedIn’s IPO
A prominent Facebook investor and director accused Wall Street of undervaluing the LinkedIn initial public offering,contributing to the doubling of its shares on opening day


http://link.ft.com/r/NA70KK/26GWVD/I51J0/5CBJ5D/9ZCRVZ/YT/h? a1=2011&a2=5&a3=31
Published with Blogger-droid v1.6.9

lunedì 30 maggio 2011

Aggiornamento del portafoglio Benjamin Graham

Con un giorno di anticipo ribilanciamo il porafoglio Benjamin Graham descritto in questo post e già ribilanciato il 25 febbraio,   il 31 marzo e il 29 aprile 2011.

Secondo lo screener del Nasdaq la composizione aggiornata con i prezzi i chiusura di venerdì 27 maggio (la borsa di New York è stata chiusa lunedì 30) vede l'uscita dal portafoglio di LPH, il ritorno di AMN,  CSR e
BNGPY (Benetton) e l'ingresso di LHCG e CTRN per un numero complessivo di titoli che sale da 6 a 10.


Value Investor Either Interest Level
Based on our analysis of the book by Benjamin Graham
Click on any header to sort by that variable.
Symbol Company All
Interest
Strong
/Some
This
Guru's
Quant
Score
Previous
Close
Mkt Value
$(Mil)
Rel.
Strength
P/E P/E/G Proj
P/E
12
mo.
 SKX   SKECHERS USA, INC.  2 / 2    100% 17.70   881   10   9   0.5   13
 SNY   SANOFI-AVENTIS SA (ADR)  3 / 0    100% 38.41   100,023   69   14   1.1   6
 LHCG   LHC GROUP, INC.  2 / 1    100% 27.13   507   26   11   0.4   12
 ELP   COMPANHIA PARANAENSE DE ENERGIA (ADR)  2 / 0    100% 26.80   6,842   78   14   0.7   8
 CTRN   CITI TRENDS, INC.  1 / 1    100% 16.66   250   10   12   2.0   12
 CW   CURTISS-WRIGHT CORP.  1 / 1    100% 33.55   1,557   41   14   3.5   13
 BNGPY   BENETTON GROUP SPA (ADR)  1 / 0    100% 14.97   1,383     9    
 AMN   AMERON INTERNATIONAL CORPORATION  1 / 0    100% 64.36   588   36   14     40
 SUHJY   SUN HUNG KAI PROPERTIES LIMITED (ADR)  1 / 0    100% 15.07   38,827     9   1.1   16
 CSR   CHINA SECURITY & SURVEILLANCE TECH. INC.  1 / 0    100% 5.09   457   51   6   0.7   5
 GD   GENERAL DYNAMICS CORPORATION  2 / 4    86% 70.20   26,114   40   10   0.8   10
 BG   BUNGE LIMITED  1 / 4    86% 72.76   10,711   81   5   0.1  
 GME   GAMESTOP CORP.  2 / 2    86% 27.75   3,920   63   10   0.4   9
 LIWA   LIHUA INTERNATIONAL, INC.  1 / 3    86% 7.60   228   28   5   0.1   4
 YHGG   YASHENG GROUP  0 / 4    86% 1.64   254     3   0.2  
 RINO   RINO INTERNATIONAL CORPORATION  2 / 1    86% 0.65   16     0   0.0  
 CBEH   CHINA INTEGRATED ENERGY, INC.  2 / 1    86% 1.84   73   4   1   0.0   1
 FUQI   FUQI INTERNATIONAL, INC.  1 / 2    86% 3.00   80   4   1   0.0  
 LPH   LONGWEI PETROLEUM INVESTMENT HOLD LTD  1 / 2    86% 1.61   162   19   2   0.1   3
 SORL   SORL AUTO PARTS, INC.  1 / 2    86% 5.28   102   13   5   0.2   5
Pricing information provided by Media General
Price as of yesterday's close price.

Qui sottoo potete vedere in un grafico il rendimento del portafoglio dal 31 dicembre 2010 a oggi, confrontato con quello dell'indice S&P500 (in azzurro). Il valore in dollari USA del portafoglio  è pari a  10,399 USD con un rendimento totale dalla data di creazione (31 dicembre 2010) di 399 USD pari al +4.0%.

Ecco le transazioni di oggi:
Sell LPH 967@1.56
Sell ELP 26@26.84
Sell SNY 19@38.68
Sell CW 24@33.82
Sell SKX 26@17.65
Sell SUHJY 46.69@15.24
Buy LHCG 38@26.8
Buy CTRN 62@16.69
Buy AMN 15@65.5
Buy BNGPY 68@15.3
Buy CSR 206@4.97

Appuntamento al 30 giugno.
Published with Blogger-droid v1.6.9

Aggiornamento al 27 maggio 2011

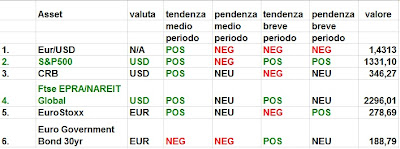
Ancora una settimana negativa per la maggior parte degli asset seguiti settimanalmente da Alfa o Beta?

L'indice di materie prime CRB (in euro) ha chiuso la settimana con un +0.2%, l'indice immobiliare (in euro) con un -1.6%, l'indice S&P500 (in euro) con un -1.3% e l'indice eurostoxx con un -1.2%. Decisamente
positivo invece l'andamento del cambio euro/dollaro +1.1% e delle obbligazioni governative trentennali dell'eurozona +1.3%. 
Questa settimana la strategia top2 perde l'1.5% e la top3 perde lo 0,9%: il drawdown della strategia top2 dal massimo di otto settimane fa è pari al 9.7%; il drawdown della top3 dal massimo del 7 gennaio 2011 è  pari al 4.6%.

Le strategie top2 e top3 con copertura del rischio di cambio effettuata da quando il 14 gennaio 2011 la tendenza di medio periodo dell'euro è diventata positiva avrebbero reso rispettivamente il +2.9% e +4.5%. 
Il rimbalzo dell'euro lo proietta nuovamente in testa alla classifica. Al secondo posto l'indice S&P500 mentre l'indice CRB di materie prime occupa il terzo posto. La  strategia top 2 suddivide quindi il capitale equipesando l'indice S&P500 e il cambio euro/dollaro mentre la top 3 aggiunge al paniere anche l'indice CRB. Chi volesse utilizzare le due strategie strategia con la copertura del rischio di cambio utilizzando una leva 3x per il cambio può costruire un portafoglio in questo modo:

top2: 37.5% S&P500, 37,5% CRB, 25% copertura cambio
top3: 25% S&P500, 25% CRB, 25% FTSE EPRA-NAREIT, 25% copertura cambio

L'unico asset con tendenza a medio termine negativa sono le obbligazioni governative europee a scadenza trentennale (ma la tendenza a breve termine è positiva) mentre la tendenza a breve termine del cambio euro/dollaro, dell'indice eurostoxx e delle materie prime è negativa.

In questo post trovate le risposte ad alcune delle domande  più frequenti relative alla metodologia che utilizzo per la costruzione della tabella e dei portafogli che aggiorno settimanalmente.

In questo post ho descritto quali ETF negoziati a Milano  replicano (in positivo o in negativo) gli indici che sono settimanalmente tracciati qui su Alfaobeta. Se volete fare delle analisi da soli, in questo post ho spiegato come procurarsi gratuitamente le serie storiche dei prezzi e dei NAV degli ETF mentre qui potete trovare qualche informazione sui costi di transazione nel mercato dei cambi.

Dall'inizio del 2011 il rendimento (valutato in euro) di un portafoglio che ogni settimana investe nei primi 2 asset (top2) della tabella è pari al -7.8%, se investito nei primi tre asset (top3) il rendimento è stato del  -2.3%. Nell'intero 2009 le stessa strategie avevano reso rispettivamente il 12.2% e il 2.4% e nel 2010 il 22.4% e il 18.2%.

Nella figura è raffigurato l'andamento di un euro investito nelle due strategie dal 3 gennaio 2009 ad oggi.

Il rendimento annuale composto della strategia top2 è del 10.5%, con una volatilità del 12.2%, un massimo drawdown del 8.4% e un indice di Sharpe di poco inferiore a 0.8.

Il rendimento annuale composto della strategia top 3 è pari al 7.5%, con una volatilità dell'11.9%, un massimo drawdown del 15.1% e un indice di Sharpe poco inferiore a  0.5.

La strategia che investe nei primi due asset a condizione che la tendenza di medio periodo sia positiva, e in contanti nel caso contrario, ha reso nell'intero 2009 il 13.9%. Nel 2010 ha coinciso con la top2 con l'eccezione di due sole settimane (questa e questa): la performance complessiva per il 2010 è stata leggermente peggiore della top2, con un +18.6%.

La strategia che semplicemente investe in parti uguali in tutti e 6 gli asset seguiti settimanalmente da Alfaobeta
ha chiuso la settimana con una perdita dello 0.2% allontanandosi così dal massimo raggiunto quattro settimane fa: il il drawdown è ora pari all'1.1%.  La strategia ha reso nel 2010 il 12.6% con una volatilità del 10% mentre dall'1 gennaio 2009 ad oggi ha reso il 34.2% con un massimo drawdown del 14.8%. Il rendimento dal primo gennaio 2011 è stato dell'1.3%. Il portafoglio top2 ha reso il 27.1% dall'1 gennaio 2009 a oggi, con un massimo drawdown del 9.7%: l'ultimo massimo è stato raggiunto il 7 marzo scorso e da allora il drawdown è proprio pari al 9.7%. Il rendimento del portafoglio top2 dal primo gennaio 2011 a oggi è stato pari al -7.8%.
La strategia che settimanalmente investe il capitale dividendolo in parti uguali negli asset che hanno una tendenza di medio periodo positiva (una versione più aggressiva della strategia di Faber che invece ripartisce il capitale tra liquidità e gli asset con tendenza di medio periodo positivo) ha chiuso questa settimana con un -0.5% anch'essa allontanandosi dal massimo storico raggiuntoquattro settimane fa. Nel 2010 ha avuto un rendimento pari al 12.1% e da inizio 2009 ad oggi ha reso il 26%, con un massimo drawdown inferiore al 7%. La volatilità è ben inferiore al 10%.  Il rendimento dal primo gennaio 2011 a oggi è stato pari al +0.6%.

E' bene ricordare che i rendimenti calcolati non tengono neppure conto dei costi di transazione e del prelievo fiscale. Mi preme comunque sottolineare che le analisi e le simulazioni descritte in questo blog sono da considerarsi sempre e comunque risultati teorici e relativi al passato. Chiunque decidesse di utilizzare le strategie descritte o qualsiasi altra informazione tratta da questo blog per decisioni di investimento se ne assume completamente la responsabilità.

Ecco l'aggiornamento al 27 maggio 2011.

domenica 29 maggio 2011

Keynes vs. Hayek: il secondo video rap

Da non perdere! Ecco qui (grazie a John Mauldin che segnala il link sulla sua lettera di questa settimana)...


Per non dimenticare che questo è un blog molto serio, molto utile (e talvolta molto profittevole): due link a una lezione che Brad De Long (decisamente un Keynes boy...) sul ciclo economico e sulla dismal science: parte uno e parte due. Secondo De Long il ciclo economico è vivo e vegeto ed è stato un madornale errore
pensare che fosse un concetto obsoleto da gettare nel dimenticatoio...

...four years ago we economists were writing learned papers about the "Great Moderation," about how it looked as though the governing institutions of the world economy had finally learned how to control and moderate if not completely eliminate the business cycle - the epileptic seizures of the economy that leave us with pointlessly high unemployment, pointlessly idle capacity, and pointlessly rusting away machines in spite of there being no fundamental cause for machines to be idle, factories closed, and workers unemployed. In such an epileptic seizure of the economy, workers are unemployed and machines are idle because there isn’t the demand to employ them, and there isn’t the demand to employ because the workers are unemployed and have no incomes.
We have been seeing these epileptic seizures called business cycles fairly regularly since at least 1825.
And we have been claiming that we have it licked fairly regularly since 1825 as well.
British Prime Minister Robert Peel thought we had it licked with his Bank of England reforms in the 1840s.
Yale professor Irving Fisher thought we had it licked in the 1920s - that the founding of the Federal Reserve and the successful winning of the war of drugs in America with the passage of Prohibition had raised living standards, eliminated the business cycle, and carried stock prices to a permanently high plateau.
In the 1960s the Commerce Department's Bureau of Economic Analysis was so convinced that the business cycle was licked they changed the title of their trademark publication from Business Cycle Digest to Business Conditions Digest. That way they could keep the BCD acronym - but they would no longer be tied to this outmoded idea that there was an inevitable business cycle.
They were all wrong.
But did we learn? No. We did it again.

venerdì 27 maggio 2011

La fede nelle bolle e i suoi rituali

Dall'Economist appena uscito:

Yandex, described as "Russia's Google", made its stockmarket debut on NASDAQ, the latest in a string of big initial public offerings in America by domestic and foreign internet companies. On May 19th LinkedIn, a networking site for professionals, saw its share price soar by 109% on its market entry. But with the shares of some recently floated tech companies, such as Renren, a Chinese firm, now trading for less than their issue prices, analysts have warned that the evidence is mounting of another tech bubble.

Al rapporto tra speranze (così rosee che solo la fede può sostenerle) e valutazione è dedicata la colonna settimanale di Buttonwood  che si era occupato della quotazione di Linkedin anche in una nota sul blog qualche giorno fa giustamente intitolata Rational man?LinkedIn and the end of the world. Secondo Buttonwood è possibile tracciare un parallelo tra le quotazioni stratosferiche dei social network e delle IPOs legate al web 2.0, le bolle nei mercati obbligazionari del debito sovrano e più in generale l'eccesso di irrazionalità che domina così tante espressioni della finanza contemporanea.

When it comes to assessing the prospects of a company like LinkedIn, a newly floated online business-networking firm, investors rely entirely on the assumption that the company’s future growth can justify the stratospheric level of its current valuation.(...). Buying shares in such a company is a leap of faith by any standard.

During the lead-up to the establishment of the European single currency, investors bought the bonds of weaker governments on the ground that all would converge on the high standing of Germany. They had faith that countries like Greece and Portugal would use the breathing space of lower interest rates to usher in economic reform. That belief proved sadly misplaced.
Finance even has its own high priests in the form of the analysts and fund managers who promise their clients heavenly rewards if only they listen to their advice. They preach regular sermons in the form of brokers’ notes and quarterly reports, and they house themselves in vast cathedral-like buildings that dominate the skyline. Each day also has its canonical hours as traders pray for profitable opportunities at the European, American and Asian market openings. Finance has its annual calendar, too, marked with festivals known as results seasons in which the lucky participants receive their temporal (rather than spiritual) dividends.
And like any self-respecting religion, finance has its doctrinal schisms as well. Active fund managers are a bit like the medieval Catholic church, offering eternal salvation to those willing to pay the appropriate sum, which are known in modern parlance as performance fees rather than indulgences.(...)  The passive fund managers, or index-trackers, are akin to early Lutherans. (...)
Finance also has its equivalent of holy men, the gurus who pronounce on the market outlook. Not for nothing is Warren Buffett known as the “sage of Omaha”. The faithful conduct an annual pilgrimage to Nebraska every year to attend the annual meeting of his company, Berkshire Hathaway. (...) Those made of sterner stuff prefer the more puritanical oratory of Nouriel Roubini, forever preaching hellfire and damnation for those (particularly the Federal Reserve) who fail to repent.
Finance seems to be a polytheistic rather than a monotheistic faith. The objects of veneration change on a regular basis from emerging markets through internet companies to commodities.(...)
Even when these cults prove to be built on sand, investors show a remarkable willingness to forget their disappointment and move on.

giovedì 26 maggio 2011

Se il mercato è efficiente Facebook vale più di Apple. E le banche di investimento avevano ragione...

Ho trovato la lettura di questo articolo su seekingalpha davvero divertente (forse anche perchè mi ha fatto sentire più giovane di almeno una dozzina d'anni)....L'autore parte da questo articolo del 1998 per valutare Linkedin, Facebook, Yahoo e Apple utilizzando le metriche in auge in piena internet-mania (e bolla...). Il risultato? Eccolo qui: basandosi sui pageviews...

Pageview Valuation Methodology
TickerAnnualized Pageviews (B per year)Equity Market Cap ($B)Value per Pageview
YHOO circa September 199852.612.8$0.24
LNKD circa May 201128.48.8$0.31
YHOO circa September 1999140.547.2$0.34
YHOO circa March 2000228.197.2$0.43
Source: Yahoo!Finance, Yahoo earnings press releases, Yahoo 10-Q filings, LNKD S-1 filings, Author Calculations
...LNKD è valutata in modo grosso modo equivalente a Yahoo nel 1999. C'è quindi spazio per un ulteriore rialzo del 20-30% prima di....


....una correzione di circa il -95% in diciotto mesi (vedi il grafico di Yahoo dal 1999 ad oggi) e di circa il -85% in undici anni! Yahoo raggiunse un prezzo massimo di 120 dollari nel 2000, per poi crollare a 5 dollari nel 2001-2002 e ancora oggi quota meno di 20 dollari.

Ma veniamo ora a Facebook. L'autore ricorre alla legge di Metcalfe per valutare Linkedin e di conseguenza anche Facebook: l'idea è che  "L'utilità e il valore di una rete sono pari ad n^2 - n dove n è il numero degli utenti". Siccome Facebook ha circa 6 volte il numero di utenti di Linkedin il suo valore (dimenticando per un attimo che utilità e valore sono due concetti assolutamente distinti, diciamo che siamo risk-neutral e buonanotte...) Facebook dovrebbe valere 36 volte Linkedin, ovvero

Using Metcalfe's Law Valuation Methodology
StockUsers (100 million)(N)N^2Enterprise Value Estimated($B)Equity Value Estimated ($B)
LNKD1.021.048.58.8
Facebook6.0036.00294.1304.5
Source: Author estimates, LNKD S-1. Note that 294.1 = 36/1.04 x 8.5
Lasciamo spazio all'autore per i commenti, ho solo evidenziato il confronto tra l'EV di Apple e quello stimato per Facebook ammettendo come "efficiente" la valutazione che il mercato ha messo su Linkedin. Il risultato è che Apple vale meno di Facebook!!!

The first and obvious comment is, why should this make any sense anyways? The notion of Metcalfe's law is that the value of the network is proportional to the square of the users. This draws in people, and hopefully through clever business models, the company can capture that value. In this case, I would wager that Facebook is a lot more sticky than LinkedIn and pulls in more people for longer periods. Simply applying the ratio to just users would suggest that Facebook is worth $52.8 billion. However, I would argue it is worth more for the previously mentioned notion of stickiness; perhaps that is worth a 45% premium to get to the $80 billion valuation noted in the beginning. Also, the $52.8 billion is consistent with the price that Goldman Sachs (GS) paid for its stake ($50 billion) earlier this year.

The next note is that the Metcalfe's Law Valuation approach puts Facebook's Enterprise Value higher than Apple's (AAPL) based upon LinkedIn's current valuation. The equity value is comparable between Facebook and Apple. Does this make any sense whatsoever? In my opinion, absolutely not. However, at the rate that Facebook's valuation is climbing, it might be the only plausible methodology to use.


A proposito di Linkedin: Andrew Ross Sorkin, l'editore di Dealbook sul New York Times, indubbiamente uno dei massimi esperti mondiali del mondo della finanza corporate, contesta la tesi di Joe Nocera, riportata e in parte condivisa da Alfa o Beta? qualche giorno fa, che le banche di investimento hanno volontariamente sottoprezzato l'IPO. Dunque avrebbe ragione l'opinione di un lettore (rara avis) che ha commentato il post. Ecco qui un ampio stralcio dell'articolo di Ross Sorkin:


The basic premise was that the bankers that underwrote LinkedIn’s I.P.O. badly underpriced the offering since the stock zoomed from $45 a share to over $120 on the first day of trading. Worse, Joe posits that the bankers did this on purpose to line the pockets of their clients at the expense of the company, which could have used the money to grow.
Before diving into this, let’s stipulate at the outset that the current I.P.O. system is not perfect and that other more innovative approaches — like a Dutch auction in which the buyers set the price — may be a better alternative.
Let’s also stipulate that the bankers behind the offering, Morgan Stanley, Bank of America Merrill Lynch and JPMorgan Chase, could have gotten a higher price for LinkedIn, from which they collected significant fees. At the same time, however, it must be noted that the banks have clients in the form of investors, so clearly the banks are playing both sides.
While we’re at it, let’s also stipulate that many people on Wall Street and elsewhere are rightly worried that a bubble is forming around social networking. LinkedIn made only $15.4 million in 2010 and is now valued at more than $8 billion.
With that context, here is another way to think about the LinkedIn I.P.O: the offering price was generous — and maybe even too high.
If you believe that LinkedIn’s stock price is part of a bubble and that it may fall back to earth, how should the underwriters’ pricing be judged in the future? If the banks had priced the offering at about $94 — the price it closed at in its first day — and it subsequently fell to $45 a share, the public (and perhaps Mr. Nocera) would be up in arms that Wall Street had foisted a lousy deal on its unsuspecting clients, who were clamoring for a supposedly hot deal.
Note, too, that Goldman Sachs, which was an early investor in LinkedIn before the offering, sold its entire stake at $45 a share at the open, leaving some $30 million in missed profit on the table. Goldman clearly did not believe that LinkedIn’s stock price — even at $45 a share — was sustainable. What do they know that the rest of the world does not?
None of this is to suggest that Morgan Stanley, Bank of America and JPMorgan got the pricing right; they clearly could have done better.
But unless we learn that the low price was determined, in part, to help themselves through kick-back schemes with favored clients, it is hard to argue the banks purposely “scammed” their client. (It is, however, something we should watch out for in this latest I.P.O. mania.)