martedì 31 agosto 2010

Le 10 regole di Taleb per navigare nel quarto quadrante

In prima pagina il Sole 24 Ore oggi ospita un ariticolo di Nassim Taleb intitolato Dieci regole esclusive per stregare il cigno nero. L'ho letto sull'aereo che mi riportava a casa dalle vacanze (purtroppo finite) e mi chiedo se la redazione del giornale abbia fatto attenzione a quello che scrive Taleb oppure se siano stati un po' distratti, contando sul prolungarsi del balletto degli equivoci che permette a banchieri e gestori distratti e/o poco coscienziosi di invocare cigni neri ogniqualvolta le cose vanno (prevedibilmente, per chi non smette di ragionare) male. Ecco qualcuna delle 10 regole di Taleb

2. No alla socializzazione delle perdite e alla privatizzazione dei guadagni
Qualunque cosa possa aver bisogno di essere salvata da un dissesto dovrebbe essere nazionalizzata; qualsiasi cosa non abbia bisogno di essere salvata da un fallimento dev'essere libera, piccola e in grado di affrontare rischi. Noi siamo entrati nelle manifestazioni peggiori del capitalismo e del socialismo. In Francia, negli anni 80 del Novecento, i socialisti hanno assunto il controllo delle banche. Negli Stati Uniti, nel decennio 2001-2010 le banche hanno assunto il controllo del governo. Questa è una cosa surreale.

3. A coloro che hanno guidato uno scuolabus a occhi bendati (e lo hanno distrutto) non si dovrebbe mai affidare un altro autobus
L'establishment economico (le università, i regolamentatori, le banche centrali, i funzionari governativi, varie organizzazioni dotate di un personale formato in gran parte da economisti) perse la sua legittimità in coincidenza con il fallimento del sistema nel 2008. Sarebbe irresponsabile e folle riporre la nostra fiducia nella loro capacità di guidarci fuori da questo disastro. E da irresponsabili anche ascoltare consigli dagli "esperti di rischi" e dagli istituti di scienze commerciali che sostengono ancora le loro misurazioni e che ci hanno ridotto sul lastrico (come il metodo di misurazione del rischio value-at-risk). Scovate le persone intelligenti che hanno le mani pulite.

4. Non lasciare che una persona che si assicura un bonus di incentivazione possa gestire una centrale nucleare, e nemmeno i tuoi rischi finanziari
È molto probabile che una tale persona sia incline a fare tagli sulla sicurezza per presentare questi risparmi come "profitti", sostenendo di essere "prudente".

I bonus non si conciliano con i rischi nascosti di gravi imprevisti. È stata l'asimmetria del sistema dei bonus a condurci alla situazione attuale. Non ci sono incentivi senza disincentivi: il capitalismo distribuisce premi e punizioni, non solo premi.


Superorsi alla riscossa: l'S&P500 a quota 450?

Albert Edwards di Société Générale capeggia un folto e agguerrito branco di superorsi convinti che nuovi abissi stiano per inghiottire i mercati azionari mondiali. Secondo il Wall Street Journal Edwards ritiene che il fair value dell'indice S&P500 sia ... 450, ovvero circa il 40% dei valori attuali:
His core thesis is that we have only just started paying down debt. With total public and private U.S. obligations near 400% of GDP, and Uncle Sam's off-balance-sheet entitlement liabilities adding 400% more, continuing to borrowing to fund growth looks challenging.
As stimulus slows, and households continue paying down debt instead of spending, the deflationary force will smack corporate earnings. In turn, price/earnings multiples could contract, perhaps drastically as long-term expectations decline.
At about 20 times average 10-year trailing earnings, as calculated by Robert Shiller, the S&P 500 is anything but cheap. Previous valuation bottoms in 1920, 1949 and 1982 saw multiples fall to between five and nine times. An eight-times multiple today would put the index at about 450.
Overly pessimistic? Admittedly, Mr. Edwards has been something of a perma-bear, but his late '90s prediction of a long "Ice Age" for stocks did materialize. Poking fun at critics he titled his latest note: "They laughed. Oh how they laughed." 

Se volete approfondire la tesi del Sig. Edwards potete leggere questo post di zerohedge. Edwards è convinto che non ci sia una bolla nelle obbligazioni governative, anzi: qui sopra potete vedere come estrapola l'andemento degli indici azionari e obbligazionari per i prossimi 12 mesi. Fate un po' voi... ma datemi retta: quando l'S&P500 toccherà quota 450 coprite gli short!

lunedì 30 agosto 2010

La nuova normalità? Un decennio di crescita anemica per gli U.S.A.

Mentre negli U.S.A. celebrano la buona notizia della nascita di una nuova banca, la prima dalla fine del 2009, i banchieri centrali e gli economisti riuniti a Jackson Hole, Wyoming, ci avvertono che la crescita dell'economia U.S.A. potrebbe continuare a essere anemica per ancora un decennio.  Secondo Carmen Reinhart The American economy could experience painfully slow growth and stubbornly high unemployment for a decade or longer as a result of the 2007 collapse of the housing market and the economic turmoil that followed, (...)
Ms. Reinhart’s paper drew upon research she conducted with the Harvard economist Kenneth S. Rogoff for their book “This Time Is Different: Eight Centuries of Financial Folly,” published last year by Princeton University Press. Her husband, Vincent R. Reinhart, a former director of monetary affairs at the Fed, was the co-author of the paper.
The Reinharts examined 15 severe financial crises since World War II as well as the worldwide economic contractions that followed the 1929 stock market crash, the 1973 oil shock and the 2007 implosion of the subprime mortgage market.
In the decade following the crises, growth rates were significantly lower and unemployment rates were significantly higher. Housing prices took years to recover, and it took about seven years on average for households and companies to reduce their debts and restore their balance sheets. In general, the crises were preceded by decade-long expansions of credit and borrowing, and were followed by lengthy periods of retrenchment that lasted nearly as long.
“Large destabilizing events, such as those analyzed here, evidently produce changes in the performance of key macroeconomic indicators over the longer term, well after the upheaval of the crisis is over,” Ms. Reinhart wrote.
Ms. Reinhart added that officials may err in failing to recognize changed economic circumstances. “Misperceptions can be costly when made by fiscal authorities who overestimate revenue prospects and central bankers who attempt to restore employment to an unattainably high level,” she warned.
Several scholars here cautioned that it was premature to infer long-term economic woes for the United States from the aftermath of past crises.

sabato 28 agosto 2010

Aggiornamento al 27 agosto 2010

Una settimana eccellente per le obbligazioni governative a lungo termine (che hanno segnato un aumento di quasi il 3%) ha compensato la lieve correzione dell'indice immobiliare (che valorizzato in euro ha perso circa lo 0.6%, un risultato brillante se si tiene conto dei dati pessimi sul mercato immobiliare USA resi noti qualche giorno fa). In questo post ho descritto quali ETF negoziati a Milano  replicano (in positivo o in negativo) gli indici che sono settimanalmente tracciati qui su Alfaobeta. Dall'inizio del 2010 il rendimento di un portafoglio ribilanciato settimanalmente e investito nei primi 2 asset della tabella è stato di circa il 14.5%, se investito nei primi tre asset il rendimento scende all'9.3%. Nell'intero 2009 le stessa strategie avevano reso rispettivamente il 12.2% e il 2.4%. La strategia che investe nei primi due asset a condizione che la tendenza di medio periodo sia positiva, e in contanti nel caso contrario, ha reso nell'intero 2009 il 13.9%.

Ecco l'aggiornamento al 27 agosto 2010.


Asset valuta tendenza  pendenza  tendenza pendenza   valore


medio medio breve  breve 


periodo periodo periodo periodo
1. Euro Government Bond 30yr EUR POS POS POS POS 206.72
2. Ftse EPRA/NAREIT Global USD POS NEG POS NEG 1829.50
3. CRB USD NEG NEG POS NEG 267.27
4. Eur/USD N/A NEG POS NEG NEG 1.2728
5. EuroStoxx EUR NEG NEG NEG NEG 251.66
6. S&P500 USD NEG NEG NEG NEG 1064.59


venerdì 27 agosto 2010

Non chiederti se i governi faranno default sui loro debiti, ma chiediti quando e come faranno default

Ieri abbiamo dedicato il post agli inguaribili ottimisti. Oggi, con spirito fortemente contrarian rispetto ai mercati che sembrano in grado di chiudere la settimana con una seduta finalmente positiva, vi consiglio la lettura del numero primo di Sovereign Subjects, una nuova newsletter degli analisti di Morgan Stanley dedicata ai rischi del debito sovrano.Il titolo è tutto un programma: Ask Not Whether Governments Will Default, But How.... buona lettura!

Morgan Stanley: "Ask Not Whether Governments Will Default, But How" 08252010.

giovedì 26 agosto 2010

Gli inguaribili ottimisti

Malgrado i terribili dati sul mercato immobiliare U.S.A., il downgrade del debito pubblico irlandese da parte di Standard & Poor’s con il conseguente riaccendersi delle ansietà sul debito sovrano europeo (e non solo europeo) ci sono ancora degli ottimisti! Visto che le vacanze volgono alla fine ma siamo ancora in agosto mi è sembrato giusto dare voce anche a loro: 
  • dalle colonne del Wall Street Journal Ross Devol, economista al Milken Institute, elenca alcune ragioni che potrebbero assicurare un futuro all'economia U.S.A. dalle tinte meno fosche di quelle che i dati sull'occupazione e sul mercato immobiliare sembrano adombrare. Secondo Devol There's a point at which pessimism becomes a self-fulfilling prophesy, scaring businesses away from investing or hiring. The dark tone of today's discourse is at risk of doing just that.The Milken Institute's new study, "From Recession to Recovery: Analyzing America's Return to Growth" is based on extensive and dispassionate econometric analysis. It concludes that the U.S. economy remains more flexible and resilient—and has more underlying momentum—than is generally acknowledged. In fact, our projections show cause for measured optimism: A return to modest but sustainable growth is close at hand.
    America's businesses are capable of navigating around policy uncertainty and the twists and turns of a volatile global economy. While slow private-sector job growth is to be expected in the early stages of a recovery, the U.S. should add 1.5 million jobs in 2010, 3.1 million in 2011, and 2.6 million in 2012. That will translate into real GDP growth of 3.3% in 2010, 3.7% in 2011, and 3.8% in 2012.
    In this pessimistic climate, this forecast will likely be considered contrarian. So why is our economic outlook more sanguine than the current consensus? For one, robust (albeit moderating) economic growth in developing countries, particularly in Asia, will provide support for U.S. exports.(...)
    Historical context offers further reason to expect a rebound. The peak-to-trough decline in real GDP during this recession was 4.1%, making it the most severe downturn since World War II. But throughout the postwar period, the rate of economic recovery from past recessions has been proportional to the depth of the decline experienced. While this relationship has been somewhat variable, it is well-established. Our projections for GDP growth are above consensus but are substantially below a normal rate of recovery after a recession of this severity.
    The naysayers are right that there's a "new normal" economy, but it's not that the potential long-term growth rate of the U.S. is substantially diminished, as they say. It's that this time, the fulfillment of pent-up demand will be subdued because consumers were living so far above their means during the bubble years. Nevertheless, consumer durables and business investment in equipment will see some previously postponed purchases finally happen—if not this year, certainly by 2011 and 2012.
    Devol poi prosegue nell'indicare una agenda all'amministrazione Obama per favorire la ripresa, primo fra tutti un punto molto dibattuto e controverso, cioè l'estensione dei tagli alle tasse decisi anni fa dal presidente Bush e che dovrebbero cessare con la fine di quest'anno. 
  • Secondo Jim Jubak,  in questi giorni in vacanza in Puglia (!), il mercato azionario U.S.A. è in questo momento completamente assorbito dalle preoccupazioni di breve termine, prima tra tutte la domanda angosciosa: Will the U.S. economy slow significantly in the second half of 2010? Is the current slowdown in growth just a normal slump that happens during many recoveries when companies have finished rebuilding inventories that were drawn down during the recession? Is the decline in home prices near an end? Will companies start hiring by the end of the year?Those are all important questions -- if you're trying to hit quarterly performance numbers or catch the exact bottom in the market. La risposta a queste domande determinerà l'andamento del mercato nel breve-medio periodo mentre they're not so important if you're investing for five years or longer.
    If you're investing in that kind of time frame, what you really want to know is which economies will outperform in the long run. You want to identify the growth industries of the next decade. You want to know where global demand is going to squeeze global supply. You want to know where the global financial power is ebbing and where it is flowing. In questo caso Jubak individua alcune buone possibilità di investimento per le quali vi rinvio all'articolo originale. Forse però non è il caso di precipitarsi a fare acquisti: The best we can do is watch the market indicators for signs that the risk of buying has ebbed to a reasonable level. And that's not yet, I'd say, with the indexes threatening to fall through resistance. We can also pick the stocks with the most long-term potential we can find when that risk level seems acceptable.Of course, that means that when you do buy, you may still wind up taking on more risk than you'd like. There's no getting around the fact that this U.S. economy is indeed uncertain. But there is one advantage to a market that on most days seems volatile and unpredictable: There isn't a lot of competition if you're an investor thinking long term about stocks

mercoledì 25 agosto 2010

L'oro, il dollaro e la deflazione prossima ventura

Giustamente il Wall Street Journal si domanda: come mai se il nostro destino è la deflazione l'oro continua a salire? Anche ieri, mentre i mercati azionari di tutto il mondo incassavano sberle considerevoli, l'oro riusciva a guadagnare un pochino. Secondo il WSJ la risposta è molto semplice: la correlazione tra inflazione e oro è molto bassa. L'oro quindi non è una commodity, che serve per proteggersi dal rischio inflazione, ma è una valuta, un'alternativa al dollaro alla quale ricorrere nei momenti in cui si ha paura che il governo U.S.A. non possa mantenere le promesse fatte. Scrive Jason Zweig nella sua colonna settimanale che
I recently asked research firm Ibbotson Associates to run a correlation study to determine how closely inflation and gold-price movements track each other. You would expect gold, as a purported commodity, and inflation to move in tandem.
The data, going back to 1978 and capturing an inflationary spike, shows a correlation of, at most, 0.08.
That is low. Really low. Perfect correlation is 1; at minus-1, two assets move in perfect opposition. Near 0 implies gold and inflation barely acknowledge one another, and moves in unison are largely happenstance.
So if inflation doesn't push and pull at gold prices, what might it be? If you believe correlation studies, the answer is the U.S. dollar.
Going back to 1973—a period that defines the modern, non-gold-backed dollar—the greenback's movements closely track gold's direction. The correlation between month-end gold prices and the Major Currencies Dollar Index, as reported by the Federal Reserve, is minus-0.45.
That clearly is a stronger correlation than you find with inflation. But let's take this a bit further. Let's shorten the time frame to the period from gold's 1980 peak to today.
The result: Over the past 30 years, the correlation between the dollar and gold is minus-0.65—a high negative correlation. It means the dollar and gold are effectively on opposite ends of a seesaw. When the dollar is in favor, gold retreats. When it is under pressure, gold prices swell.
Look at the nearby chart. It is like a photo of a mountain scene reflected in a tranquil lake. The rises and falls and horizontal meanderings of gold are nearly the negative of the dollar's.
The implication is that gold isn't a commodity—at least not one that hews to the definition of something that people and industry consume.
Instead, "gold is a currency" whose daily price is a gauge of the market's concern about the "potential diminishment" of the purchasing power of the dollar and other paper currencies, says Paul Brodsky, a principal at New York's QB Asset Management.
[SCISSORS]
If he is correct, it is the potential longer-term weakening of the dollar that is the real issue for the gold market, not inflation or deflation.(...)
If, however, you worry the U.S. balance sheet is irreparably damaged, then gold currently reflects the likelihood that a weak-dollar trend still has years to run as the U.S. struggles with its financial mess. Investors—and consumers—looking to preserve their purchasing power will gravitate toward gold, since its quantity isn't easily manipulated.
Invest in gold, then, according your beliefs about the future of the greenback. Just don't invest based on the idea that gold is a proxy for inflation. You are likely to be played for a fool.

martedì 24 agosto 2010

Un po' di ottimismo da Credit Suisse e come giocarsi la deflazione prossima ventura

Secondo gli analisti di Credit Suisse, dopotutto, gli Stati Uniti non sono il Giappone e con un po' di fortuna ci salveremo. Non solo: nell'ultima parte di questo rapporto di un paio di giorni fa si danno alcune indicazioni su come posizionarsi se invece si pensa che i deflazionisti avranno ragione.
Ecce report:

No Japanese Repeat for the Us

lunedì 23 agosto 2010

E se arriva il crash? O, peggio ancora, un cigno nero? Ci salverà Taleb o il polpo Paul?

Si moltiplicano sul web i profeti di sventura: eccitati dall'Hindenburg Omen, dalle prospettive di deflazione e dai dati sempre più deprimenti sull'occupazione negli Stati Uniti in molti si chiedono se quest'autunno assisteremo a una replica del collasso dei mercati dell'autunno del 2008. In questo articolo il Wall Street Journal ricapitola 10 buone ragioni per essere cauti e prepararsi al peggio. Ve le elenco qui di seguito rinviandovi all'articolo per il commento:

1. The market is already expensive.
2. The Fed is getting nervous.
3. Too many people are too bullish.
4. Deflation is already here.
5. People still owe way too much money. 
6. The jobs picture is much worse than they're telling you.
7. Housing remains a disaster.
8. Labor Day is approaching. 
9. We're looking at gridlock in Washington.
10. All sorts of other indicators are flashing amber. 
 
Abbiamo già discusso più volte come le azioni siano relativamente a buon prezzo se confrontate alle obbligazioni, specialmente se si ha un po' di fiducia nelle previsioni per gli utili del 2011 (e questa è veramente una scommessa). Lo scenario macro si è certamente indebolito negli ultimi mesi, anche se la curva dei tassi di interesse non sembra ancora segnalare guai in vista (ma anche in questo caso occorre un po' di cautela, visto l'intervento delle banche centrali sui mercati obbligazionari): come giustamente commenta il WSJ What message then is in the yield curve fortune cookie? For now, it seems to be: dimmer recovery, but not quite lights out.

Se tuttavia si allarga lo sguardo al mondo intero è difficile trovare ragioni per essere ottimisti: tra una bolla immobiliare che aspetta di esplodere (Cina), i numerosi problemi geopolitici irrisolti o aggravati dalle politiche più o meno irresponsabili e/o contraddittorie degli ultimi anni, il debito sovrano che avanza in quasi tutto il mondo, le siccità e le inondazioni, insomma con tutto quello che può andare storto, anche senza invocare il saggio Murphy  (if anything can go wrong it will), sembra una buona idea prepararsi per il peggio, per un cigno  nero particolarmente antipatico, e investire una quota del proprio portafoglio di conseguenza, puntando sull'Armageddon. 
Secondo il Wall Street Journal A growing number of money managers and financial firms are rolling out investment products designed to exploit big declines known as "black swan" events. Most of the products are geared toward institutional investors such as pension funds, endowments and high-net-worth families—but black-swan strategies are trickling down to Main Street as well.(...)The basic idea behind Mr. Taleb's black-swan strategy is to keep most of your money ultrasafe, and to bet a small portion—say 10%—on options contracts or other speculative bets whose prices will soar during a market panic. 
Funziona? Pare di sì!  Funds run by Universa Investments LP, a Santa Monica, Calif., hedge fund managed by Mr. Taleb's longtime collaborator Mark Spitznagel, gained more than 100% in 2008.
Lo straordinario successo del fondo Universa ha dato origine a più di 20 
hedge funds che impiegano strategie destinate ad essere premiate in caso di avvenimenti rari, tipicamente sottostimati e spesso ignorati nella progettazione dei prodotti di ingegneria finanziaria.
Some of these specialized funds aim to profit when markets tank. Others are designed to protect against a market plunge but still profit when markets rise. Investors don't typically put all of their money into these funds—but they are putting in more these days.
Retail investors are getting more access to black-swan-oriented strategies, too. Bond-fund giant Pacific Investment Management Co., or Pimco, has recently begun using tail-risk strategies in its Pimco Global Multi-Asset Fund, which launched in October 2008; in its RealRetirement target-date funds; and in its new equity funds launched this year. The firm also has filed a registration statement with regulators to offer exclusive "private placement" investments to well-heeled investors using tail-risk hedging strategies.
Some individual investors even are considering setting up black-swan portfolios of their own. "The 2008 downturn got me thinking that black swans can happen and will happen," says Justin McCurry of Raleigh, N.C. The 30-year-old transportation engineer says he is thinking of putting a small portion of his portfolio into options as a way to "limit downside or to pick up some extra money if things went crazy."

Una delle ragioni principali all'origine del successo di questi fondi è lo spettacolare insuccesso della diversificazione come strumento difensivo nel 2008, quando quasi tutti gli asset sono affondati all'unisono (con l'eccezione delle obbligazioni del Tesoro, ma non ci scommetterei di nuovo se si ripresentasse un panico di proporzioni simili a quello dell'autunno 2008).
Diversification "works most of the time, but when it doesn't work, those times really kill you," says John Liu, who heads up Citi Portfolio Solutions, a newly formed unit at Citigroup Inc. dedicated to developing and managing tail-risk hedging strategies for institutional investors.
But black-swan investing has its risks, too. The biggest: When markets are behaving normally, the strategy can miss out on a rising stock market—even as costs add up.
That is because the strategy typically involves buying lots of out-of-the-money "put" options on everything from stock indexes and interest rates to currencies. Put options confer the right to sell the underlying instrument if the price falls to a certain level. Because they offer protection, their values soar during market panics, producing big profits for the holders. But if the market doesn't plunge, the options expire worthless, and the investor must buy new options to replace the old ones. (...)
Another risk: Because black-swan events are so unpredictable, the markets' reactions to them can be equally unpredictable. Just because an approach worked last time doesn't mean it will work in the future. 


Per chi vuole tentare il fai-da-te la ricetta originale è ancora la migliore, e non troppo difficile da realizzare:   In "The Black Swan," Mr. Taleb recommends a "barbell" strategy in which investors put 85% to 90% of their portfolios in extremely safe instruments, like Treasury bills, and the remaining 10% to 15% in highly speculative bets such as options.
That strategy is designed to lose a little bit during most years and to profit handsomely when markets tank. 

Chi è poù sofisticato può anche usare le opzioni in modo più profittevole e smalizato (con qualche rischio in più): One alternative is to use a hedging technique designed to allow investors to participate in rallies while staying protected during black-swan crashes. "When you eliminate your upside, you really get hammered over time," Mr. Smetters says.
His strategy aims to limit losses to 10% in a market crash but also allow for significant upside potential. To do that, he builds a type of "zero-sum collar" that uses a combination of put options to limit losses and call options to take advantage of the upside. (Whereas puts give investors the right to sell a particular security at a predetermined price, calls give investors the right to buy.) As the market rises, Mr. Smetters says, he cashes in the small gains from the call options and purchases new ones. 
 
In quest'ultimo caso il nemico è un mercato che non va da nessuna parte, facendo scadere sia le put che le call out of the money. 

Qualcuno conosce in che modo investe il polpo Paul?

domenica 22 agosto 2010

Una bolla nelle obbligazioni? Don't fight the fed!

Nell'ultimo numero dell'Economist Buttonwood si occupa delle obbligazioni in un articolo dal titolo significativo: A bull market in pessimism. Mentre anche nelle ultime due settimane è continuata la discesa dei tessi di interesse delle obbligazioni del Tesoro USA molti commentatori si sono domandati se non si stia materializzando una bolla. Lo scenario sul quale sembrano scommettere gli investitori in obbligazioni è una prolungata fase di quasi-deflazione, con il fallimento del quantitative easing 2 promesso dalla Fed. Secondo l'Economist The principal on American inflation-linked bonds rises with the consumer price index, but does not drop below its par value even if the CPI declines. This protects investors' principal in the event of deflation. Michael Gapen of Barclays Capital has calculated the value of this "deflation put option" and rekons it suggests a 10-15% probability of deflation over the next five years. That is  down sharply from 70% in late 2008, though still up from zero before the crisis.
Bond investors expect a concerted effort by the Fed to ward off the risk of deflation, however small. Much of the decline in the real ten-year Treasury yield this year, from 1.5% to 1%, reflects investors' expectations that the Fed will now wait until late 2011 to start raising its interest-rate target of 0-0.25%. 
Tassi di interesse così bassi sono una manna per i governi indebitati dai postumi della crisi finanziaria e (nel caso di molti paesi europei) da anni di cattiva gestione dei bilanci. Dal punto di vista degli investitori la realtà è assai differente: Today's yields offer precious little cushion should inflation turn out higher, growth stronger or central banks less accomodating than current predictions.
 
Inoltre in molti osservano come le obbligazioni siano diventate care se confrontate con i rendimenti attesi dal mercato azionario: Analysts at JPMorgan calculate that the "equity-risk premium", the expected excess return of shares over government bonds, is at a record high in America, reflecting an 8% earnings yield on stocks and a 1% real yield on bonds. Per la Germania la differenza è ancora più marcata con un 10% di earnings yield (calcolato sui profitti attesi per il 2011) rispetto a un rendimento inferiore all'1% reale del Bund decennale.

Secondo Buttonwood ci sarà tutto il tempo di riposizionarsi: finchè la paura della deflazione on sarà passata Central banks are not only likely to keep their policy rates on hold for the forseeable future, they may, for good measure, buy more bonds themselves. Low yields could be here for a good while yet. Insomma, vale sempre il vecchio adagio: Don't fight the Fed!

sabato 21 agosto 2010

Krugman e gli austeriani

Dalle colonne del New York Times Paul Krugman se la prende con gli austeriani (i fautori dell'austerità a tutti i costi) per il rallentamento dell'economia U.S.A. e la continua discesa dei tassi di interesse:


So how do austerians deal with the reality of interest rates that are plunging, not soaring? The latest fashion is to declare that there’s a bubble in the bond market: investors aren’t really concerned about economic weakness; they’re just getting carried away. It’s hard to convey the sheer audacity of this argument: first we were told that we must ignore economic fundamentals and instead obey the dictates of financial markets; now we’re being told to ignore what those markets are actually saying because they’re confused.
You see, then, why I find myself thinking in terms of strange and savage cults, demanding human sacrifices to appease unseen forces.
And, yes, we are talking about sacrifices. Anyone who doubts the suffering caused by slashing spending in a weak economy should look at the catastrophic effects of austerity programs in Greece and Ireland.
Maybe those countries had no choice in the matter — although it’s worth noting that all the suffering being imposed on their populations doesn’t seem to have done anything to improve investor confidence in their governments.
But, in America, we do have a choice. The markets aren’t demanding that we give up on job creation. On the contrary, they seem worried about the lack of action — about the fact that, as Bill Gross of the giant bond fund Pimco put it earlier this week, we’re “approaching a cul-de-sac of stimulus,” which he warns “will slow to a snail’s pace, incapable of providing sufficient job growth going forward.”
It seems almost superfluous, given all that, to mention the final insult: many of the most vocal austerians are, of course, hypocrites. Notice, in particular, how suddenly Republicans lost interest in the budget deficit when they were challenged about the cost of retaining tax cuts for the wealthy. But that won’t stop them from continuing to pose as deficit hawks whenever anyone proposes doing something to help the unemployed.
So here’s the question I find myself asking: What will it take to break the hold of this cruel cult on the minds of the policy elite? When, if ever, will we get back to the job of rebuilding the economy?

Aggiornamento al 20 agosto 2010

Una buona settimana per gli unici due asset con tendenza di medio periodo positiva: le obbligazioni governative a lungo termine hanno segnato un aumento dell'1.8% e l'indice immobiliare un aumento dell'1.1% (se valorizzato in euro). In questo post ho descritto quali ETF negoziati a Milano  replicano (in positivo o in negativo) gli indici che sono settimanalmente tracciati qui su Alfaobeta. Dall'inizio del 2010 il rendimento di un portafoglio ribilanciato settimanalmente e investito nei primi 2 asset della tabella è stato di circa il 13.6%, se investito nei primi tre asset il rendimento scende all'8.6%. Nell'intero 2009 le stessa strategie avevano reso rispettivamente il 12.2% e il 2.4%.

Ecco l'aggiornamento al 20 agosto 2010.


Asset valuta tendenza  pendenza  tendenza pendenza   valore


medio medio breve  breve 


periodo periodo periodo periodo
1. Euro Government Bond 30yr EUR POS POS POS POS 200.78
2. Ftse EPRA/NAREIT Global USD POS NEU POS NEU 1842.53
3. CRB USD NEG NEU POS NEU 267.01
4. Eur/USD N/A NEG NEU NEG NEG 1.2736
5. EuroStoxx EUR NEG POS NEG NEU 253.03
6. S&P500 USD NEG NEU NEG NEU 1071.69

giovedì 19 agosto 2010

Ancora sulle obbligazioni e sull'Hindenburg Omen

Piccola rassegna di post sull'argomento obbligazioni e sull'Hindeburg Omen:
  • iniziamo con due post di Bespoke: nel primo si contesta (senza un riferimento esplicito) l'affermazione che the Dow's dividend yield is now greater than the 10-Year Treasury yield (...and...) that this is the first time this has happened in decades, but in actuality, the Dow's yield got much higher than the 10-Year yield as recently as late 2008 and early 2009. La differenza oggi aumenta ancora con il calo del Dow e dello yield dei bond decennali dopo la pubblicazione dei dati economici U.S.A. così deludenti. Nel secondo, dedicato all'Hindenburg Omen, si fa osservare come
    A closer look at the list of new highs, however, shows that the "stocks" hitting new highs last Thursday were hardly stocks at all. The WSJ provides a list of NYSE listed stocks hitting new highs and new lows on a daily basis, and looking at last Thursday's list of new highs shows that practically all of them were closed-end fixed income securities, preferred stocks, or some other form of fixed income product masquerading as an equity. In fact, of the 92 issues that hit new highs on Thursday (8/12), less than ten were common stocks.
    Se si limita l'analisi del segnale alle azioni, escludendo quindi le obbligazioni scambiate sul NYSE e travestite da azioni, per esempio limitandosi ad analizzare le azioni che costituiscono l'indice S&P500  si scopre che il 12 agosto scorso only 0.2% of the stocks in the S&P 500 hit new highs while 5.6% of the stocks in the index hit new lows. A day when 5.6% of the stocks in the S&P 500 hit new lows is hardly a sign of strength, but it also doesn't reflect the indecision and confusion that the Hindenburg Omen is supposed to convey. Call us crazy, but an indicator that measures the internals of the equity market should probably avoid using fixed income securities in its analysis. On a side note, the Hindenburg Omen was last triggered in June 2008, and back then the indicator would have been triggered using either the NYSE or the S&P 500.
    Insomma: non solo il fondamento statistico dell'Omen è perlomeno discutibile ma anche la sua definizione ha forse bisogno di qualche  piccolo aggiustamento. 
  • Brad De Long contesta l'analisi dei monetaristi osservando come la velocità del denaro abbia oscillazioni sempre più ampie rispetto alla trendline e in questo post interviene nel dibattito sulla bolla nel mercato delle obbligazioni del Tesoro U.S.A., rispondendo all'articolo di Siegel e Schwartz sul WSJ e raccontato ieri da Alfaobeta. Secondo De Long in questo caso parlare di una bolla è fuorviante poichè A bubble--I thought--is when those holding an asset do so because they expect its price to rise more-or-less indefinitely, and such a price rise is impossible. Such a bubble is very prone to rapid collapse when people realize that their expectations are very wrong. Do holders of U.S. Treasury bonds expect the prices of the assets they own to rise more-or-less indefinitely? No, they do not. They expect their holdings of Treasury bonds to be and to continue to be safe places to park their money, and they expect other asset classes to be risky.
    Over time, I think, the fear of other asset collapses will ebb--but this is highly likely to produce a gradual rise in the prices of other asset classes and a gradual fall in Treasury prices, but a gradual fall does not make Treasury bonds unsafe.
    Those who hold Treasuries to maturity will get the returns they expect: for holders-to-maturity, Treasury bonds are indeed very safe absent a very unlikely upward leap in inflation.
    So I cannot see any possibility of a bubble collapse at the short end of the Treasury market--less than ten years, seven.
    Secondo De Long anche chi investe in obbligazioni con durata lunga, fino ai trenta anni, corre rischi molto limitati, specialmente se si tiene conto della situazione macroeconomica. La differenza di posizione con Siegel-Schwartz non è sorprendente perchè riflette anche visioni divergenti delle prospettive dell'economia U.S.A. come avevo osservato ieri nel commento al loro articolo. Ecco come conclude il suo post Brad De Long:  Could there be a sudden large downward movement in Treasury bond prices that would convince holders of Treasuries that they are not safe at all and induce a wave of panicked selling that would look like the collapse of a bubble?
    In asset prices, never say never: the only thing you can ever say with absolute certainty is J.P. Morgan's: "they will fluctuate."
    But I don't think so. People today buy an on-the-run ten-year Treasury at a yield of 2.64%--the bond with a 2.65% coupon maturing on August 15, 2020 at a price of 100.07. Its price drops tomorrow to 88.96. Do they conclude that their long Treasury position is too risky to hold? Or do they conclude that the Treasury correction has come and gone, and that Treasuries are actually safer than ever?
    To argue that there is a Treasury bond bubble going on, you have to believe that such a fall in Treasury bond prices would induce further selling. And I cannot see that--not with the current state of macroeconomic news.

mercoledì 18 agosto 2010

Il rischio di una bolla nelle obbligazioni

Sono sempre più numerosi gli investitori pronti a scommettere su un rialzo dei tassi di interesse (dimenticando così il motto don't fight the Fed...). Secondo il WSJ with yields hovering around 2.65% on the 10-year and around 3.75% on the 30-year, some investors are again betting on a reversal. One area of activity: call options on an exchange-traded fund known as the TBT, which uses double-leverage to bet that the price of long-dated Treasurys will fall, and so their yields will rise.
Questo ETF non è armonizzato e in Italia l'unico ETF short con leva doppia è BUND2S.MI che ha come indice di riferimento il Bund future (la cui galoppata continua da oltre quattro mesi e pare inarrestabile).
A favore della tesi di una bolla nelle obbligazioni governative si sono espressi Jeremy Siegel e Jeremy Schwartz sul Wall Street Journal di oggi:  
secondo Siegel e Schwartz le valutazioni attuali delle obbligazioni non assicurano rendimenti ragionevoli in parte anche perchè we believe U.S. economic growth is likely to accelerate. 
Furthermore, economists generally agree that the most important determinant for long-term economic growth is productivity, not consumer demand. Despite the subpar productivity growth reported for the last quarter, the latest year-over-year productivity growth of 3.9% is almost twice the long-term average. For the first two quarters of this year productivity growth, at over 6%, was the highest since the 1960s. 
Se condividete l'ottimismo sulle prospettive future dell'economia U.S.A. non potete esimervi dal condividere le conclusioni: 
From our perspective, the safest bet for investors looking for income and inflation protection may not be bonds. Rather, stocks, particularly stocks paying high dividends, may offer investors a more attractive income and inflation protection than bonds over the coming decade.(...)
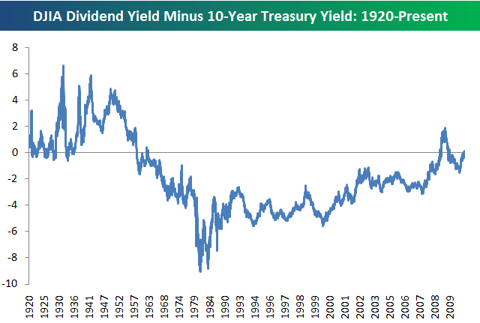
Today, the 10 largest dividend payers in the U.S. are AT&T, Exxon Mobil, Chevron, Procter & Gamble, Johnson & Johnson, Verizon Communications, Phillip Morris International, Pfizer, General Electric and Merck. They sport an average dividend yield of 4%, approximately three percentage points above the current yield on 10-year TIPS and over one percentage point ahead of the yield on standard 10-year Treasury bonds. Their average price-earnings ratio, based on 2010 estimated earnings, is 11.7, versus 13 for the S&P 500 Index. Furthermore, their earnings this year (a year that hardly could be considered booming economically) are projected to cover their dividend by more than 2 to 1.
Due to economic growth the dividends from stocks, in contrast with coupons from bonds, historically have increased more than the rate of inflation. The average dividend income from a portfolio of S&P 500 Index stocks grew at a rate of 5% per year since the index's inception in 1957, fully one percentage point ahead of inflation over the period. That growth rate includes the disastrous dividend reductions that occurred in 2009, the worst year for dividend cuts by far since the Great Depression.
Those who are now crowding into bonds and bond funds are courting disaster. The last time interest rates on Treasury bonds were as low as they are today was in 1955. The subsequent 10-year annual return to bonds was 1.9%, or just slightly above inflation, and the 30-year annual return was 4.6% per year, less than the rate of inflation.
Furthermore, the possibility of substantial capital losses on bonds looms large. If over the next year, 10-year interest rates, which are now 2.8%, rise to 3.15%, bondholders will suffer a capital loss equal to the current yield. If rates rise to 4% as they did last spring, the capital loss will be more than three times the current yield. Is there any doubt that interest rates will rise over the next two decades as the baby boomers retire and the enormous government entitlement programs kick into gear?
With future government finances so precarious, private asset accumulation and dividend income must become the major sources of retirement funding. At current interest rates, government bonds will not be the answer. One hundred times earnings was the tipping point for the tech market a decade ago. We believe that the same is now true for government bonds

Ma l'evidenza di una bolla nelle obbligazioni è così lampante secondo alcuni, che addirittura basta andare da McDonald per accorgersene! Non mi credete? Sentite qui: 


L'Hindenburg omen viziato dalla bolla nelle obbligazioni?

Dal sito del Wall Street Journal, la parte divertente viene verso il secondo minuto:


Gli asset seguiti da Alfaobeta e gli ETF negoziati a Milano che li replicano.

Un lettore mi chiede quali ETF negoziati a Milano  replicano (in positivo o in negativo) gli indici che sono settimanalmente tracciati qui su Alfaobeta. Senza che questo voglia costituire una raccomandazione di investimento ecco un elenco (senza pretese di completezza) di ETF che replicano (più o meno fedelmente) gli indici della tabella settimanale. Fate molta attenzione perchè la liquidità e gli spread sono parecchio variabili passando da un ETF a un altro (anche per lo stesso indice).
  • Euro Government Bond 30yr: X25E.MIIBGL.MI e EM15.MI. Non mi risulta che vi siano ETF short per le obbligazioni governative a lunghissimo termine (15-30 anni) mentre S10.MI replica in negatvo le obbligazioni governative con scadenza tra i 10 e i 15 anni.
  • EPRA/NAREIT Global (immobili): IWDP.MI. Anche in questo caso non conosco ETF short.
  • CRB (commodities): CRB.MI. Sono numerosi gli ETF che replicano indici di materie prime diversi dal CRB. L'ETFS SALL.MI replica in negativo l'andamento dell'indice DOW JONES-UBS COMMODITY INDEX
  • EuroStoxx 600: gli ETF  XSX6.MIEXSA.MI replicano l'indice Stoxx600, che comprende anche titoli europei al di fuori dell'eurozona (soprattutto inglesi e svizzeri). Per lo short si può utilizzare DJS.MI
  • S&P500: CSSPX.MI, XSPX.MI, ESEEUR.MI, IUSA.MI e SPX.MI. Per lo short XSPS.MI
  • EUR/USD: non conosco ETF che replichino il cambio euro-dollaro. Quasi tutti i broker consentono di investire sul cambio (tipicamente in marginazione, anche con leve molto alte). Altrimenti qui potete fare una piccola ricerca tra i numerosi certificati di investimento e tra i covered warrant legati al cambio eurodollaro.

martedì 17 agosto 2010

Un nuovo crash in autunno?

I sostenitori dell'analisi tecnica sono molto sensibili agli indicatori di breadth: un mercato sano deve avere un buon bilancio tra tori e orsi in modo da sostenere i trend in atto, specialmente al rialzo. Un indicatore temutissimo è l'Hindenburg Omen poichè espressamente concepito per anticipare possibili crash del mercato azionario U.S.A. Secondo il Wall Street Journal la definizione dell'indicatore prevede:

The Omen's Criteria

All criteria must be met for a confirmed occurrence.
  • The daily number of new NYSE 52-week highs and the daily number of new 52-week lows must both be greater than 2.5% of the total issues traded that day.
  • The smaller of the 52-week highs and lows must be greater than or equal to 79 (or 2.5% of 3,168 issues).
  • The NYSE's 10-week moving average must be rising.
  • The McClellan Oscillator, a measure of market fluctuations, must be negative.
  • New 52-week highs can't be more than twice the new 52-week lows. (However, it is acceptable for the new 52-week lows to be more than double the 52-week highs.)
L'Omen ha svolto un buon lavoro nell'anticipare i crash degli ultmi 20 anni:

The Omen was behind every market crash since 1987, but also has occurred many other times without an ensu. ing significant downturn. Market analysts said only about 25% of Omen appearances have led to stock-market declines that can be considered crashes.
"The Hindenburg Omen does show some deteriorating internals, which signals some major concerns," said Ryan Detrick, senior technical strategist at Schaeffer's Investment Research. "But it isn't a reason to move to 100% in cash. We're taking a wait-and-see approach, but considering its recent history, we're considering it more than other indicators."

Se volete saperne di più potete dare un'occhiata anche qui. 
Bisogna però stare molto attenti a tirare delle conclusioni sugli indicatori di crash: il campione statistico che si ha a disposizione è limitatissimo (è curioso che nessuno abbia provato a verificarne l'affidabilità su altri mercati, come ad esempio quello inglese, tedesco o giapponese...se qualche lettore è in grado di indicarmi qualche referenza bibliografica o qualche post sul web a questo riguardo gli sarei molto grato). Una discussione dell'affidabiltà di questo indicatore che solleva la questione del rischio di data mining e overfitting of rules to historical data è svolta nel blog di CXOadvisory. In particolare l'efficacia dell'Omen sembra essere dovuta al successo nell'anticipare i crolli del 1987, del 2001 e del 2008, come indica la figura qui accanto. Tenete presente che dal 1986 ad oggi si contano 27 segnali in tutto.

lunedì 16 agosto 2010

Il sorpasso.

Ma non c'era già stato? Boh. Comunque...il New York Times celebra il sorpasso dell'economia cinese ai danni di quella giapponese,
rinforzato dai pessimi dati sull'economia giapponese resi noti stanotte.  The recognition came early Monday, when Tokyo said that Japan’s economy was valued at about $1.28 trillion in the second quarter, slightly below China’s $1.33 trillion. Japan’s economy grew 0.4 percent in the quarter, Tokyo said, substantially less than forecast. That weakness suggests that China’s economy will race past Japan’s for the full year. 
Il sorpasso dell'economia U.S.A. è previsto per il 2030. La corsa pare inarrestabile anche perchè per la maggior parte dei cinesi il benessere è ancora lontano:  China is in the throes of urbanization and is far from developed, analysts say, meaning it has a much lower standard of living, as well as a lot more room to grow. Just five years ago, China’s gross domestic product was about $2.3 trillion, about half of Japan’s.
This country has roughly the same land mass as the United States, but it is burdened with a fifth of the world’s population and insufficient resources.
Its per capita income is more on a par with those of impoverished nations like Algeria, El Salvador and Albania — which, along with China, are close to $3,600 — than that of the United States, where it is about $46,000.

Augurando alla Cina che non finisca così:

Krugman e Siegel all'attacco di Bernanke, ovvero le indecisioni della Fed

Povero Bernanke! Non c'è più solo Krugman ad accusarlo di paralisi ma anche Jeremy Siegel accusa la Fed di non fare abbastanza per sostenere la crescita dell'economia U.S.A. Secondo Krugman America’s current economic troubles aren’t exactly identical to those of Japan in 1999-2000: Japan was experiencing outright deflation, while we aren’t — yet. But inflation is well below the Fed’s target of around 2 percent, and it is continuing to slide. And Americans face a level of unemployment, and sheer human misery, far worse than anything Japan went through.
Yet the Fed is doing almost nothing to confront these troubles.
What could the Fed be doing? Back when, Mr. Bernanke suggested, among other things, that the Bank of Japan could get traction by buying large quantities of “nonstandard” assets — that is, assets other than the short-term government debt central banks normally hold. The Fed actually put that idea into practice during the most acute phase of the financial crisis, acquiring, in particular, large amounts of mortgage-backed securities. However, it stopped those purchases in March.
Since then, the economic news has grown steadily worse. And earlier this week, the Fed changed course — but barely. It now says that it will reinvest the proceeds from maturing securities in long-term government bonds. That’s a trivial change, basically the least the Fed could get away with without facing a firestorm of criticism — and far short of the major asset-purchase program the Fed should be undertaking.
A differenza della Banca Centrale Europea uno degli obiettivi statutari della Federal Riserve Bank è promuove la massima occupazione. Da qui l'accusa senza mezzi termini di Krugman: while the Fed sits there in its self-inflicted paralysis, millions of Americans are losing their jobs, their homes and their hopes for the future. 
La prosa di Siegel è meno appassionata ma la sostanza è più o meno la stessa. Per cominciare  The Fed’s move on August 10 to “keep the balance sheet of the central bank stable” and offset the run-off of mortgage-backed securities with Treasury purchases was just a baby step.  Much stronger measures can and should be taken to combat the economic slowdown.  Secondo Siegel la Fed dovrebbe ridurre a zero i tassi di interesse che paga sulle riserve bancarie e riprendere la strategia di quantitative easing espandendo le riserve del sistema bancario. Il meccanismo è ben illustrato dallo stesso Siegel: Banks hold large excess reserves because they wish to show regulators and investors a high level of liquidity.
This does not mean that banks would hold unlimited excess reserves.  In fact, banks are not happy earning near zero interest on these reserves, nor are investors satisfied with similar rates on their money market funds.  Placing more zero-interest reserves into the banking system will tempt more banks to make loans where the profit margin is much higher.
Although the Fed’s main policy tool, the Fed Funds rate, works on short-term interest rates, QE has the potential to lower longer-term rates, especially if the asset purchases are concentrated in long-dated securities.

domenica 15 agosto 2010

Letture domenicali.

Un po' di letture per una domenica oziosa in spiaggia (o in attesa della prova generale, per i senesi in città):

  • per fortuna che c'è la Germania! L'analisi del New York Times dei dati economici pubblicati venerdì scorso: Statistics released Fridaybuttress Germany’s view that it had the formula right all along. The government on Friday announced quarter-on-quarter economic growth of 2.2 percent, Germany’s best performance since reunification 20 years ago — and equivalent to a nearly 9 percent annual rate if growth were that robust all year. The strong growth figures will also bolster the conviction here that German workers and companies in recent years made the short-term sacrifices necessary for long-term success that Germany’s European partners did not. And it will reinforce the widespread conviction among policy makers that they handled the financial crisis and the painful recession that followed it far better than the United States, which, they never hesitate to remind, brought the world into this crisis. A vast expansion of a program paying to keep workers employed, rather than dealing with them once they lost their jobs, was the most direct step taken in the heat of the crisis. But the roots of Germany’s export-driven success reach back to the painful restructuring under the previous government of Chancellor Gerhard SchröderBy paring unemployment benefits, easing rules for hiring and firing, and management and labor’s working together to keep a lid on wages, Germany ensured that it could again export its way to growth with competitive, nimble companies producing the cars and machine tools the world’s economies — emerging and developed alike — demanded.
  • Il mercato degli ETF negli USA è talmente sviluppato che le società si fanno causa per poter scegliere i ticker più attraenti. Perchè? E' semplice: siccome siamo tutti agenti razionali....Researchers have shown that U.S. stocks with catchy tickers like BID or LUV perform better than those with unpronounceable trading symbols—at least in the short run. In Italia potremmo suggerire ETF con tickers come FIGO.MI oppure SGHEI.MI....Per andare corti che ne pensate di SOLA.MI?
  • L'indebolimento dell'euro negli ultimi due-tre giorni viene imputato da alcuni alla faticosa asta dei BTP con scadenze lunghe. Ma la domanda più interessante è un'altra: l'austerità dei bilanci degli stati dell'eurozona ucciderà la ripresa economica? Secondo il Wall Street Journal A fiscal multiplier above one implies a dollar of government spending generates more than a dollar of GDP; a fiscal multiplier below one implies that it is less effective. A working paper from the European Central Bank estimates that fiscal policy in the euro area has become less effective over time, with an increase in government spending of 1% of GDP generating a response of just over 0.5%, down from over 1% in the late 1980s. A fiscal multiplier below one doesn't automatically mean government-stimulus efforts are wasted, since the boost to GDP could still be important to counteract falling private demand. But the ECB paper argues that the decline in effectiveness is due to rising government debt; as private-sector concerns about the sustainability of public finances increase, individuals and companies rein back spending amid fears of future tax increases. With the euro-zone bond-market crisis, this process may have reached its logical conclusion. Not all government spending is equal: Multipliers on capital investment are reckoned to be much higher, for instance, than on government consumption or tax cuts. But if the fiscal multiplier overall is less than one, then tightening shouldn't be self-defeating: Public finances can improve even with weak growth.Better public finances should also reduce the risk premiums investors demand on government bonds; this, in turn, should make risk assets more attractive, providing companies with better financing conditions. Indeed, sometimes fiscal tightening appears to drive economic growth. A study of OECD countries from 1970 to 2007 by Alberto Alesina and Silvia Ardagna shows that of 107 episodes in which severe fiscal tightening took place, growth accelerated significantly relative to the G-7 average on 26 occasions, or 24%. Remarkably, this is slightly higher than the 22% of periods when very loose fiscal policy drove better growth. A vital question is whether private-sector confidence is boosted by austerity. If it is, and growth picks up, then the really important debate about tightening still lies ahead—and in the realm of monetary, rather than fiscal, policy. Io sono un matematico di professione, non un esperto di statistica. Tuttavia trarre delle conclusioni da un confronto del 24% rispetto al 22% su un campione di 107 casi mi sembra un esempio eccellente di cattivo giornalismo. 
  • E' sempre più dura trovare un lavoro per gli immigrati, ovunque nei paesi sviluppati, tranne che in Ungheria


sabato 14 agosto 2010

Aggiornamento al 13 agosto 2010.

L'onda verde della scorsa settimana si è già ritirata e già quattro asset hanno invertito la tendenza di medio periodo. Resistono solamente le obbligazioni governative europee di lunghissimo periodo e i fondi immobiliari. Se cercate due ETF armonizzati che replichino questi indici potete dare un'occhiata alla pagina dedicata agli ETF di borsa italiana .
Tra gli ETF che investono in obbligazioni governative di lungo periodo trovate X25E.MIIBGL.MI e EM15.MI mentre per il mercato immobiliare dei paesi sviluppati c'è IWDP.MI.
Dall'inizio del 2010 il rendimento di un portafoglio ribilanciato settimanalmente e investito nei primi 2 asset della tabella è stato di circa il 12%. Nell'intero 2009 la stessa strategia aveva reso il 12.2%.  Ecco l'aggiornamento al 13 agosto 2010.


Asset valuta tendenza  pendenza  tendenza pendenza   valore


medio medio breve  breve 


periodo periodo periodo periodo
1. Euro Government Bond 30yr EUR POS POS POS POS 197.26
2. Ftse EPRA/NAREIT Global USD POS POS POS NEU 1832.55
3. CRB USD NEG NEG POS NEU 268.79
4. Eur/USD N/A NEG POS NEG NEG 1.2813
5. EuroStoxx EUR NEG POS POS NEU 257.90
6. S&P500 USD NEG NEG NEG NEU 1079.25